Rockwell Automation 5370-CVIM2 Module User Manual
Page 315
5
Chapter
Chapter 7
Inspection Tools
7–77
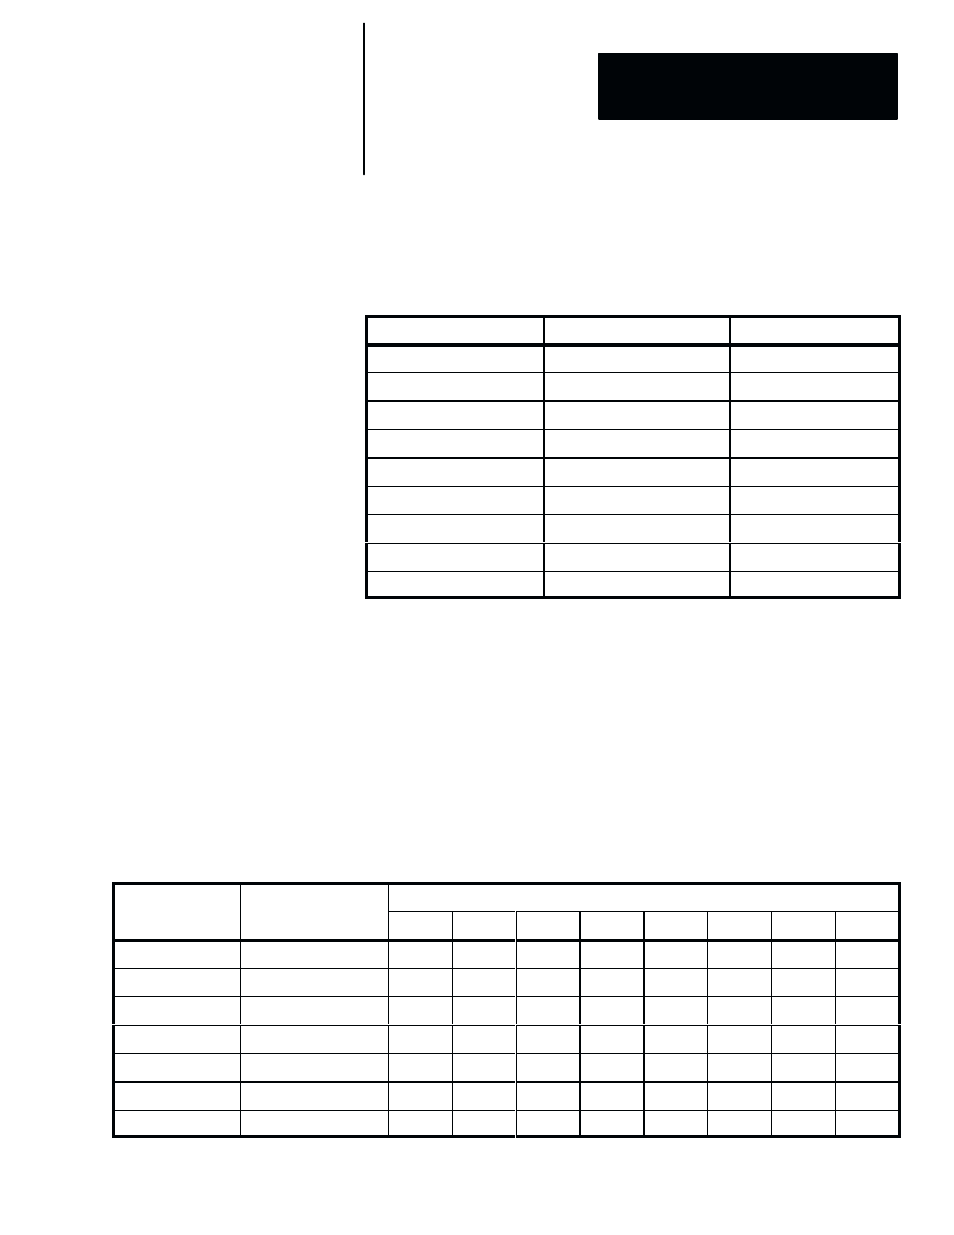
The availability of the contrast function, and the maximum contrast values,
are both related to the specific kernel selection. Table 7.3 identifies the kernel
selections and their corresponding contrast functions and values.
Table 7.3 Summary Table of Kernels and Maximum Contrast Values
Kernel Selections
Contrast Function Enabled?
Max. Contrast Value
Sobel X
Yes
2
Sobel Y
Yes
2
Laplace
Yes
1
X Edge
Yes
3
Y Edge
Yes
3
Average 3x3
Yes
3
Average 5x5
Yes
4
User 3x3
➀
➀
User 5x5
➀
➀
➀
Depends on the kernel configuration.
Convolution Kernels and LUT Selections
Table 7.4 correlates the convolution kernels (except the two user–
configurable kernels) with the LUTs (look–up tables). The table shows
whether a kernel produces a signed image, which contains pixel values
between –128 and +127, or an unsigned image, which contains pixel values
between 0 and +255, and it indicates which LUTs are most appropriate for
each kernel.
Table 7.4 Summary Table: Kernels and Appropriate LUTs
Convolution
Output Image:
Appropriate LUTs
Convolution
Kernel
Output Image:
Signed or Unsigned
Ident.
Sign
Abs.
Inv.
Clip
S.Clip
Thres.
S.Thr.
Sobel X
Signed
No
Yes
Yes
No
No
➀
No
Yes
Sobel Y
Signed
No
Yes
Yes
No
No
➀
No
Yes
Laplace
Signed
No
Yes
Yes
No
No
➀
No
Yes
X Edge
Signed
No
Yes
Yes
No
No
➀
No
Yes
Y Edge
Signed
No
Yes
Yes
No
No
➀
No
Yes
Average 3x3
Unsigned
Yes
No
No
Yes
Yes
No
Yes
No
Average 5x5
Unsigned
Yes
No
No
Yes
Yes
No
Yes
No
➀
May be useful if threshold is adjusted to remove negative values.