MTS Series 793 User Manual
Page 405
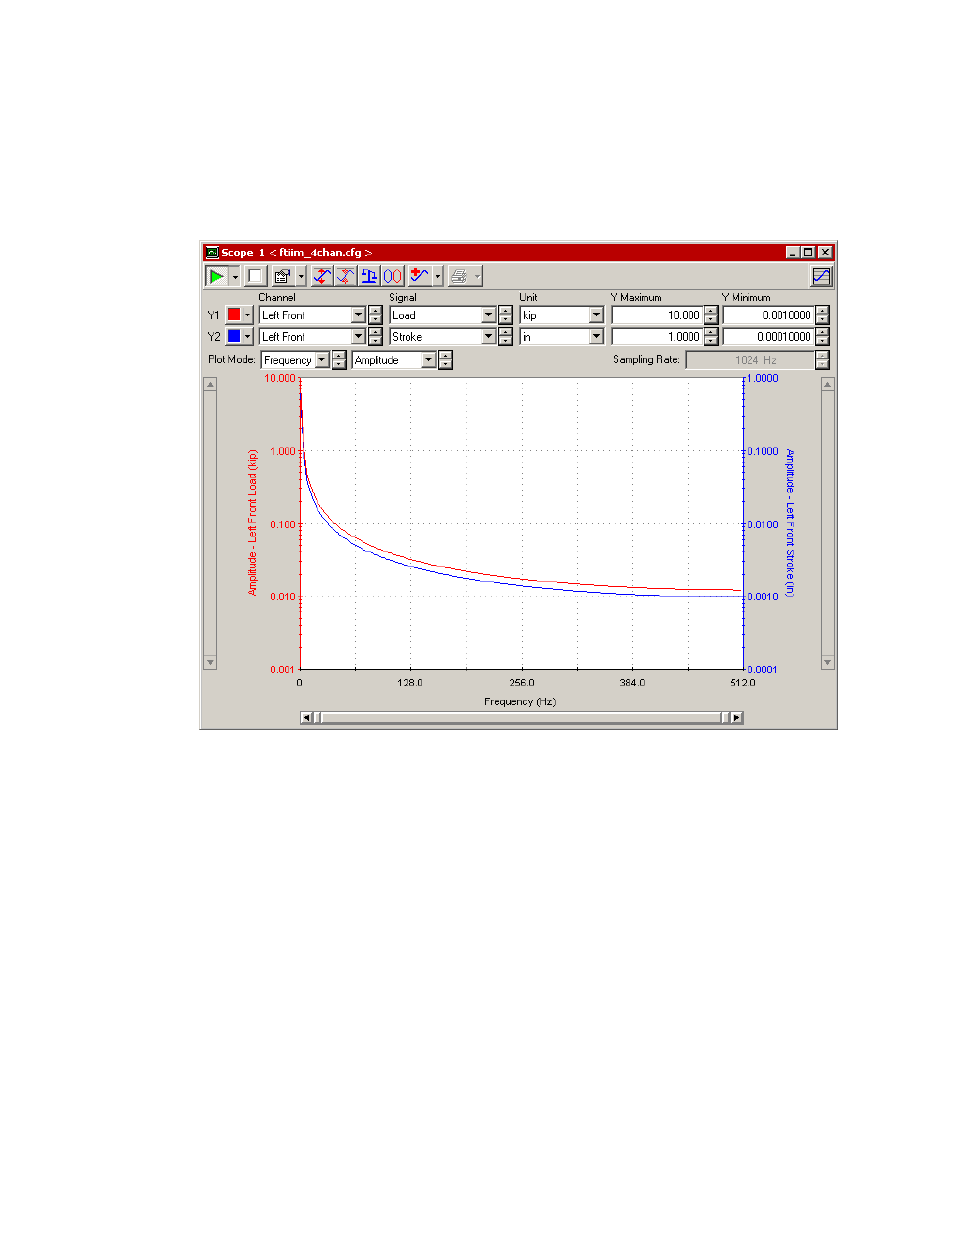
c) For Plot Mode, select Frequency.
d) Select the desired frequency plot type as ASD (Auto spectral Density), Amplitude, FRF (Frequency
Response Function), or Coherence.
For frequency plots, the frequency Pan-Zoom control is enabled when the scope is running. The Y1
and Y2 Pan-Zoom controls are disabled for logarithmic scaling, and enabled for linear scaling.
3. Customize the plot as required:
•
In the toolbar, click the Setup Scope icon to set up the scope display as desired using the Graph and
Trace and Frequency Plot Mode tab controls.
•
Y Maximum/Y Minimum–Specifies the Y-axis maximum and minimum.
For FRF (Frequency Response Function) and Coherence modes, the Y Maximum and Y Minimum
controls pertain to the single trace that is calculated from both signals in the signal pair.
•
Sampling Rate–Specifies how frequently the scope acquires data.
This value is set to the system rate and cannot be changed.
•
For Coherence plot types: the Coherence is always 1 when Averaging is set to None (This is
mathematically correct for a single frame of data). If “near’ instantaneous” Coherence is desired, set
Averaging to Exponential and Averages to 2.
MTS Series 793 Control Software 405
Scopes and Meters