3 diagrams and project comparison, 4 cost comparison top 3, Diagrams and project comparison ( 381) – Lenze DSD User Manual
Page 381: Cost comparison top 3 ( 381), 14 energy efficiency
Lenze · Drive Solution Designer · Manual · DMS 4.2 EN · 12/2013 · TD23
381
14
Energy efficiency
14.1
Lenze BlueGreen Solutions
_ _ _ _ _ _ _ _ _ _ _ _ _ _ _ _ _ _ _ _ _ _ _ _ _ _ _ _ _ _ _ _ _ _ _ _ _ _ _ _ _ _ _ _ _ _ _ _ _ _ _ _ _ _ _ _ _ _ _ _ _ _ _ _
14.1.3
Diagrams and project comparison
14.1.4
Cost comparison TOP 3
Designation
Description
Cost
Cost schedules as line diagram.
• The amortisation date of the investment can be detected easily when all fixed
costs have been entered.
• Note:
• The calculation is based on a constant utilisation of the machine.
• Changes of the basic price are not taken into consideration.
Detailed energy costs
Energy costs shown as bar diagram.
• The energy costs of the drive system are shown as bars.
• The energy costs of the components have different colours. This makes it easy for
you to detect the cost differentials.
Project comparison
Representation of the data in tabular form.
• Energy values and costs of the application and components can be compared eas-
ily.
Designation
Description
TOP 3
Ranking of the drive systems according to different cost criteria.
• The three projects that are shown in the list, depend on the selected cost criteri-
on.
Project no.
Project number that are automatically assigned to the project.
• DSD assigns the project number according to the sequence of the opened
projects.
K
sum
Sum consists of energy costs K
E
(variable costs and investment costs K
ext
(fixed
costs).
K
Δ
Difference of the total costs K
sum
of the projects.
• The difference to the highest value in the list is displayed.
K
ext
Investment costs (fixed costs).
K
E
Energy costs (variable costs)
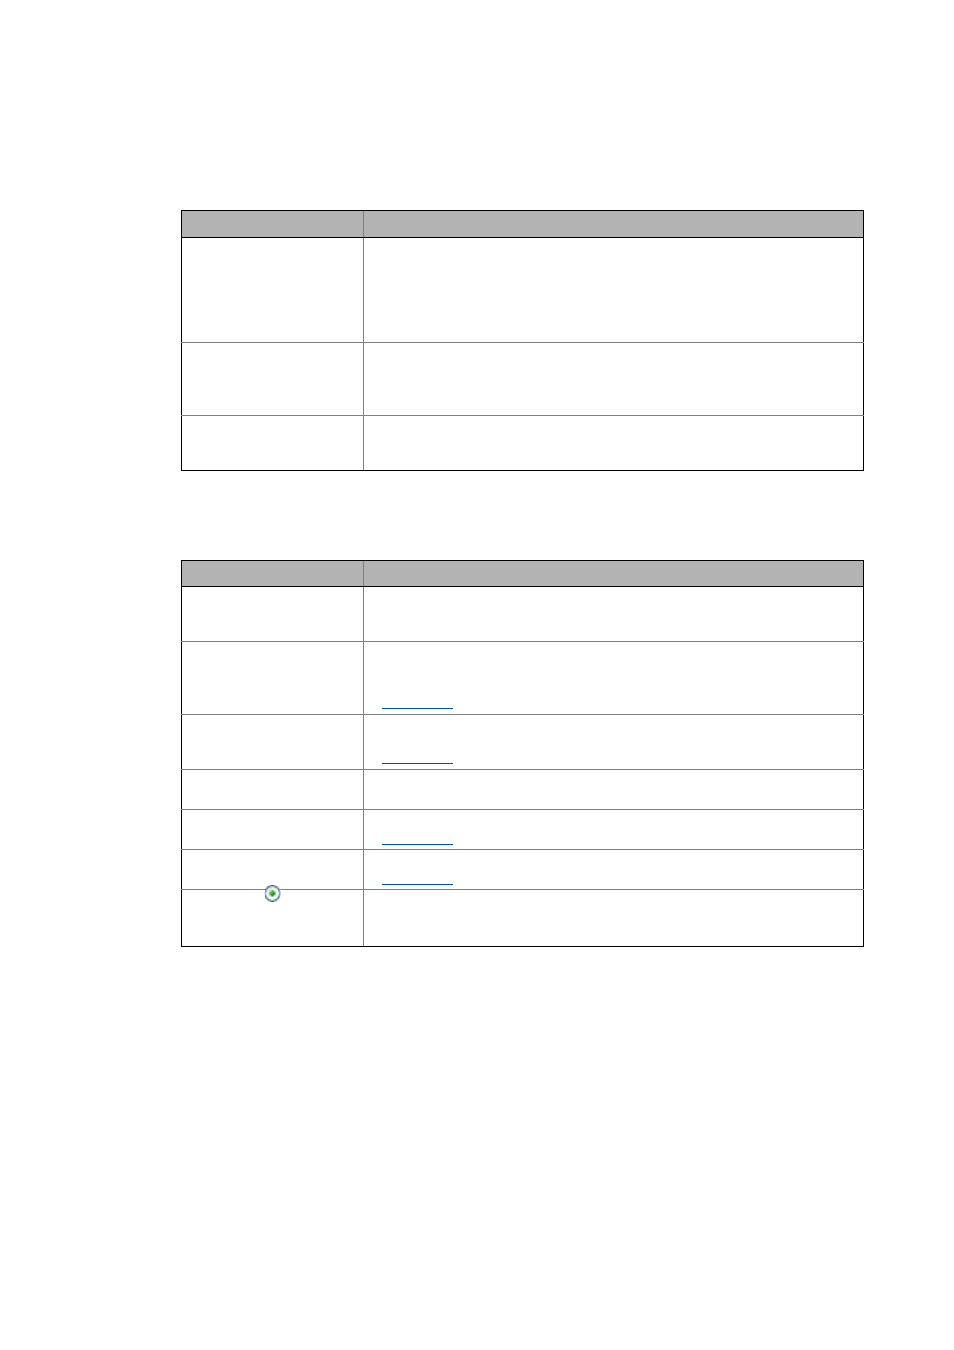
Sorting of the table according to a cost criterion.
• Select the column with the costs you want to consider.
• The sorting is ascending, starting with the lowest costs.