Dot density maps – Pitney Bowes MapInfo Professional User Manual
Page 269
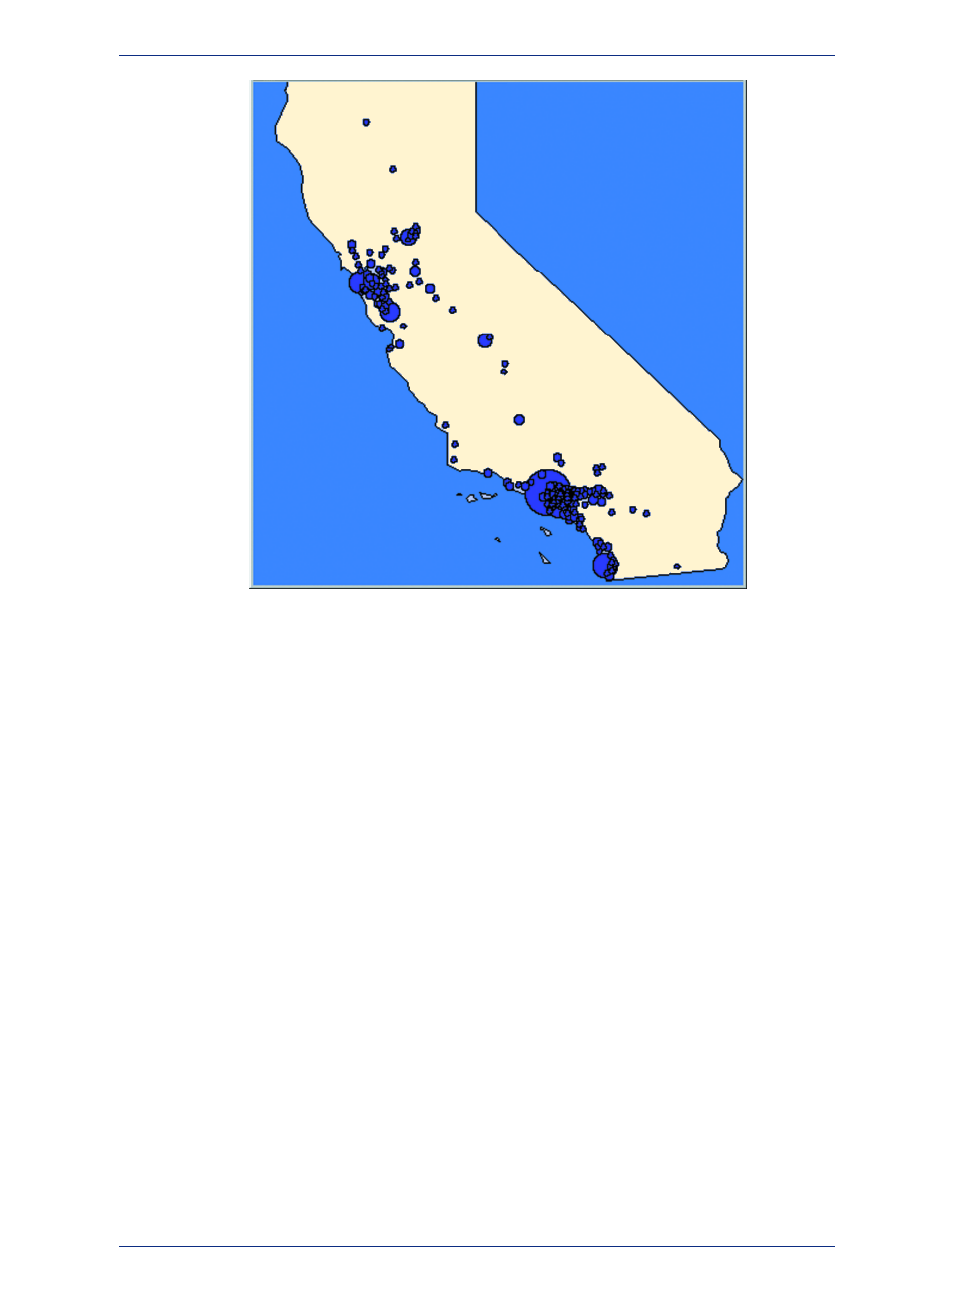
Graduated Symbol Map
There are three attributes you can customize on a graduated symbols map: the color, type, and size of
the symbol. To change the symbol's attributes in Create Thematic Map - Step 3 of 3, choose Customize
Settings and click the symbol icon in the Customize Graduated Symbols dialog box to access the
Symbol Style dialog box. The default symbol is a red circle.
In the Customize Graduated Symbols dialog box, the size of the symbol in the Symbol box is the size
for the value listed in the at Value box. All values between the high value and zero have interpolated
point sizes. If you want the symbols at the low end to be larger, increase the point size.
You can also display symbols for negative data values. To change it, click Options in the Customize
Graduated Symbols dialog box. There is a separate symbol picker so that you can make this symbol
as distinct from the symbol for positive values as you want. When you click the icon a different Symbol
Style dialog box displays, enabling you to choose a different symbol type, change the color or the size,
or change any combination of the three attributes. The default symbol for negative values is a blue circle,
and all values between zero and the low value (a negative number) also have interpolated point sizes.
The Help System contains these related topics:
• Creating a Graduated Symbols Map
• Customizing a Graduated Symbols Map
• Modifying a Thematic Map
Dot Density Maps
Dot density maps use dots to represent the data value associated with a boundary or region. The total
number of dots in a region represents that region's data value. If you have 10,000 senior citizens in a
county, and each dot represents 100 senior citizens, there would be 100 dots in the county boundary.
269
MapInfo Professional User Guide
Chapter 10: Creating Thematic and Other Themed Maps