Working with multi-table and multi-variable graphs, Exploding a pie graph – Pitney Bowes MapInfo Professional User Manual
Page 154
Working with Multi-Table and Multi-Variable Graphs
This section of the chapter provides some examples of ways you can customize your graphs. The first
example illustrates some of the ways you can customize a pie graph. The second example demonstrates
how you can customize a 3D graph using the 3D viewing angle feature.
Exploding a Pie Graph
Creating a basic pie graph is easy using the Graph wizard. Simply select the table and the fields you
want to graph. You can also graph a subset of a table, as shown in the next figure, by browsing the
selection, and using the Save Copy As command to save the selection as a permanent .tab file.
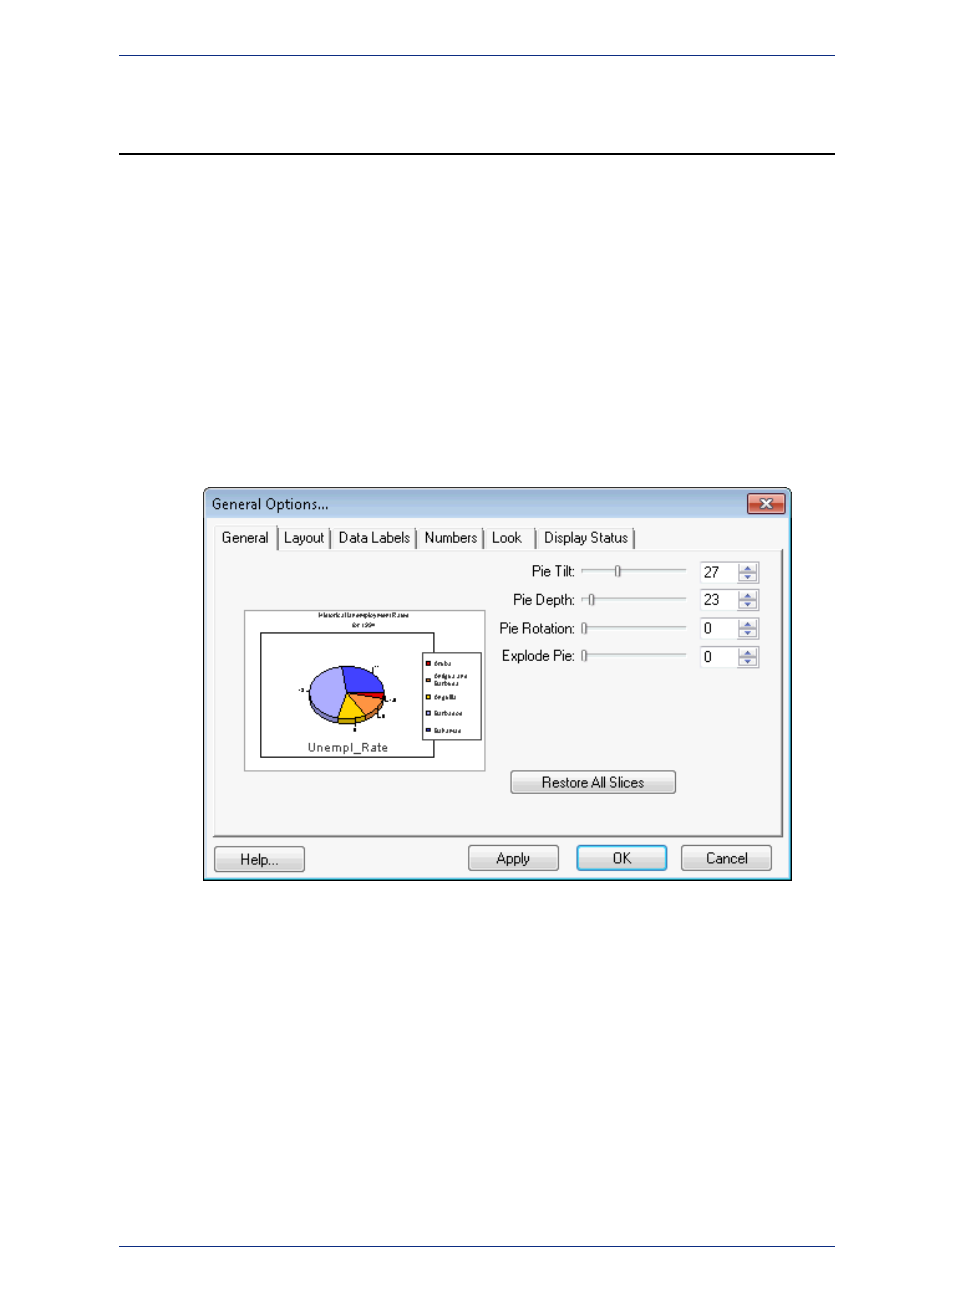
The General Options for pie graphs let you manipulate the look and rotation of the pie slices easily. The
left side of the dialog box shows a preview of what the finished pie graph will look like. You can change
the tilt, or the angle at which you vie the pie. You can give the pie a 3D look by using the Pie Depth
setting.
Some of the files described in this example may refer to MapInfo Professional Tutorial data,
which is available on the MapInfo web site,
Note:
You can also rotate the pie or explode the pie. When you explode the pie, you detach all the slices away
from the center. You can also detach an individual slice away from the pie center using the Series Options
(on the Graph menu, click Series).
The following graph shows the same pie graph, based on the General Options settings.
MapInfo Professional 12.5
154
Working with Multi-Table and Multi-Variable Graphs