3d graphs - using the 3d viewing angle – Pitney Bowes MapInfo Professional User Manual
Page 155
3D Graphs - Using the 3D Viewing Angle
The 3D Viewing Angle feature displays your 3D graph at different angles, as well as customize other
aspects of the graph's position, such as its rotation and position in the Graph window. The following 3D
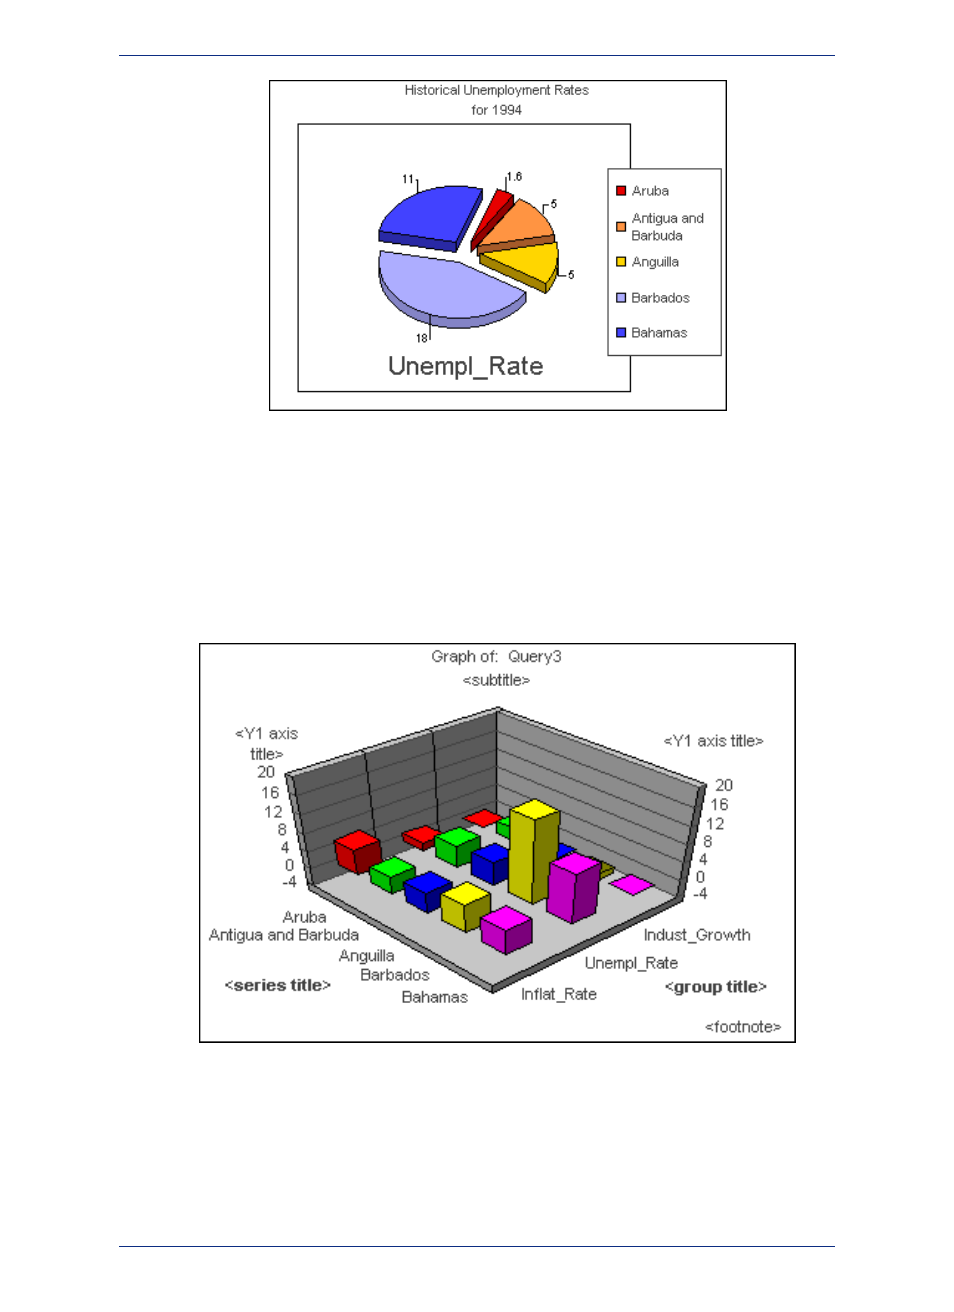
graph shows the same selection from the table that was used in the pie graph, but graphs different
columns from the table. This example rotates the angle of the 3D graph and the changes the thickness
of the walls of the 3D cube.
When you choose the 3D Viewing Angle option, preset angles for your graph display. You can choose
one of these, or use the Advanced options to create your own angle, position, and rotation. The Advanced
portion of the dialog box displays additional controls that allow you to scroll through the presets more
quickly, and manipulate the angle and position of the graph manually.
155
MapInfo Professional User Guide
Chapter 6: Graphing Your Data