Placing graphic information in visible columns – Pitney Bowes MapInfo Professional User Manual
Page 135
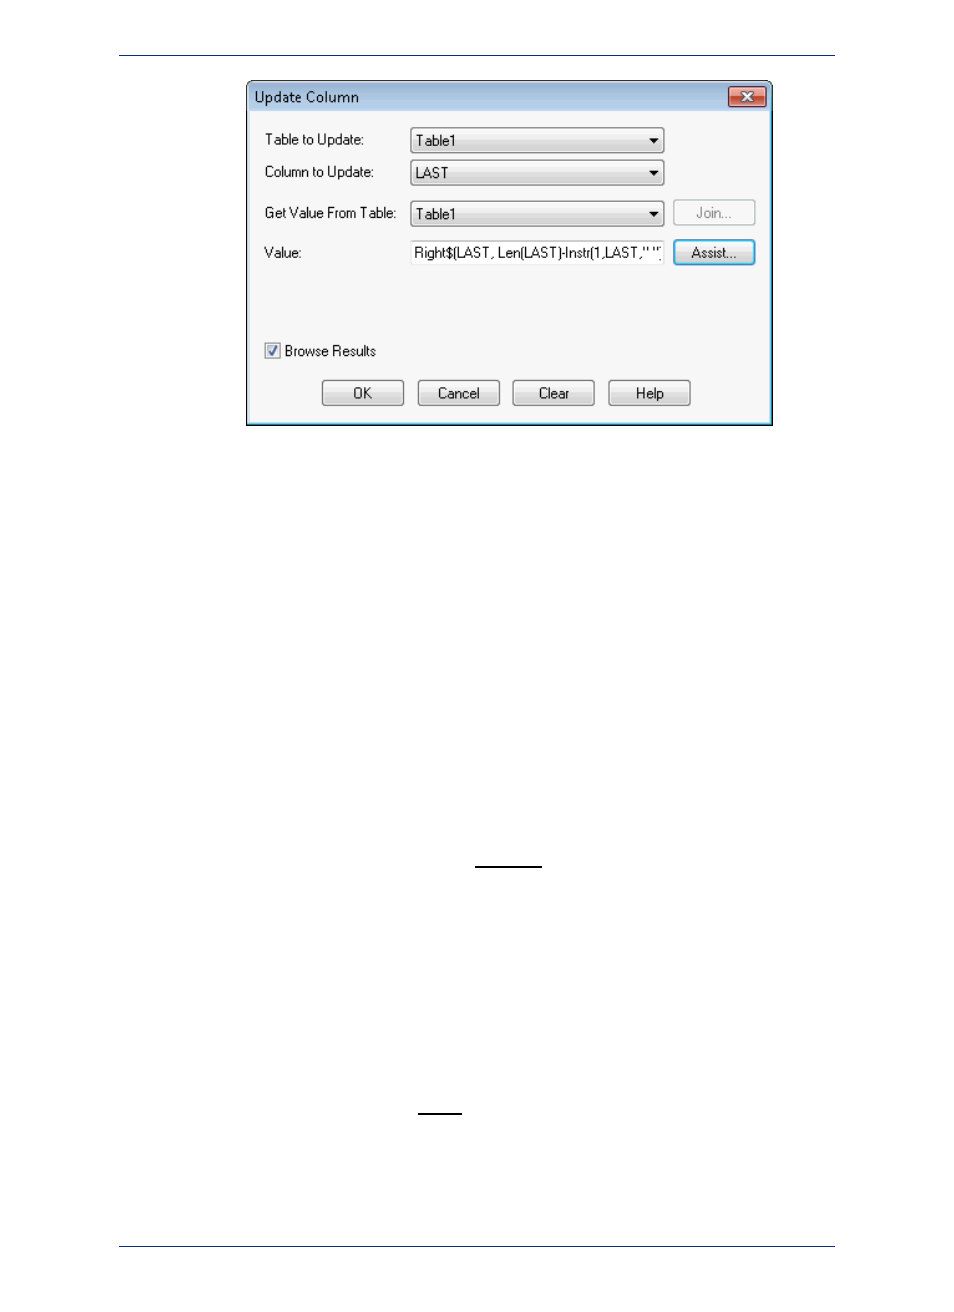
The Value is: Right$(LAST, Len(LAST)-Instr(1,LAST," "))
8. Click OK to update the column.
Placing Graphic Information in Visible Columns
Update Column is also useful to put graphic information into columns so that it is visible. Tables that
contain map objects store the graphic information about these objects invisibly. Using Update Column,
you can bring some of that information into a column so it can be viewed in a Browser. Update Column
with CentroidX(Obj), CentroidY(Obj) uses the Session Projection Preferences (if set), otherwise it defaults
to Longitude/Latitude. For example, you want to display the longitude and latitude coordinates of a table
of radio station point locations in a Browser. In this example, you are only working with one table,
RADIOLOC, but you still use Update Column as in the Add Temporary Column example.
• For more information, see Placing Geographic Information in Visible Columns in the Help System.
Mouse Wheel Support for Browser Window
When you are working in the Browser window, you can use the mouse wheel to scroll through the records.
Roll the mouse button down to scroll down the list, and roll the mouse button up to scroll up the list. You
can still use the Tab key to scroll right and the <Shift+Tab> keys to scroll left in the Browser window.
For a list of keystrokes to help you navigate in a Browser window, see
Adding a Row to a Table
You can add a temporary row to an editable MapInfo table.
To add a new row:
1. On the Window menu, click New Browser window.
2. Choose an editable table from the drop-down list.
3. Click OK to display the table in a Browser window.
4. Choose Edit > New Row (or press Ctrl+E), a new row is added to the bottom of the table.
5. Enter data in the new row.
When you are finished adding rows, choose File > Save Table to save new data.
135
MapInfo Professional User Guide
Chapter 5: Understanding Your Data