Ranged maps – Pitney Bowes MapInfo Professional User Manual
Page 264
You are not limited to representing numeric values with thematic mapping. Nominal values also may be
shaded thematically. For example, you have a table of underground cables. Those cables that have not
been serviced in the past six months are labeled priority status. Using Individual Values, you can shade
the cables according to their repair status. All records with the same value will be shaded the same. See
the individual sections later in this chapter for more information on each type of thematic map. They offer
general information on the methods available for creating thematic maps. For more information on any
of these methods and options, see Thematic Mapping in the Help System
Ranged Maps
When you create a ranged thematic map, MapInfo Professional groups all records into ranges and
assigns each record's object the color, symbol, or line for its corresponding range. For example, if you
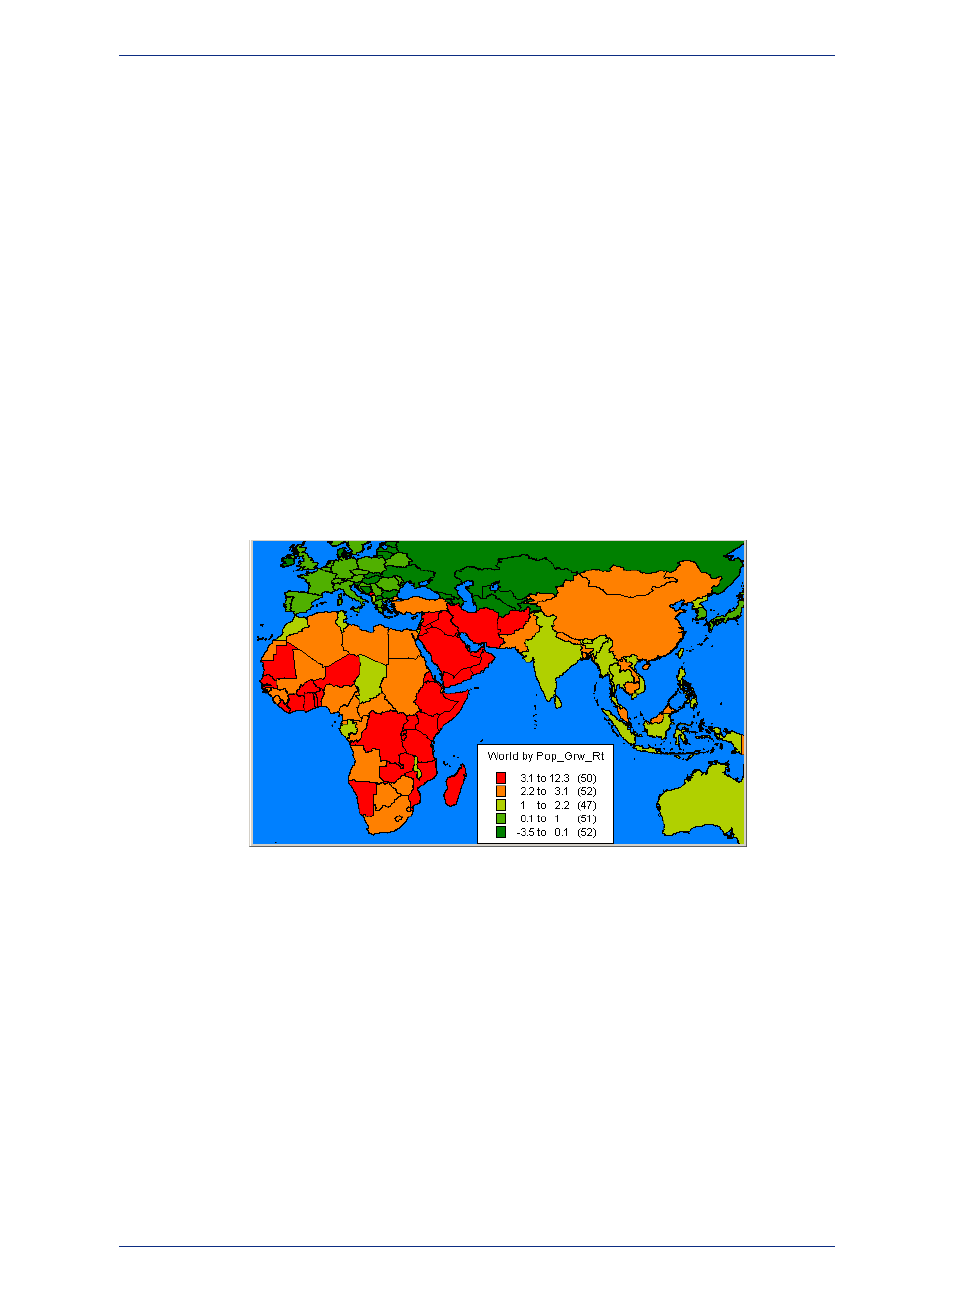
wanted to visualize the population of the world by growth rate, you would shade countries according to
their reported growth rate amounts.
With the Ranged map feature, MapInfo Professional groups the growth rate amounts into ranges. For
example, in the next table, all countries that had growth rates between zero and one percent are grouped
into one range. Countries that had growth rates between one and 2.2 are grouped in a separate range.
Countries that have rates between 2.2 and 3.1 are in a third range, and those countries reporting greater
than 3.1 are in a fourth range.
Figure: Ranged Map
All records are assigned to a range and then assigned a color based on that range. For example, the
countries with the higher growth rates are shaded in red. The other ranges are shaded in lighter shades
of red to light green and finally darker green. When you display the map, the colors make it readily
apparent which locations have the highest growth rate in relation to their neighbors.
Ranges are also useful when the size of the region is not directly related to the magnitude of the data
values. In our population density example in this section, we see that countries that are small in size can
be very densely populated, and countries that are large in size may not be densely populated. Differences
like these are more readily apparent when the regions are shaded in this manner.
Types of Ranged Values
MapInfo Professional can create ranges automatically using five methods: Equal Count, Equal Ranges,
Natural Break (Standard Deviation), Quantile, and Custom. To set ranges manually, use Custom.
Equal Count has the same number of records in each range. If you want MapInfo Professional to group
100 records into 4 ranges using Equal Count, MapInfo Professional computes the ranges so that
approximately 25 records fall into each range, depending on the rounding factor you set.
MapInfo Professional 12.5
264
Using Thematic Mapping to Analyze Information