Tanks by sites, Tanks trends graph, Daily inventory by fuel type report – Gasboy Fleet Head Office System User Manual
Page 292: Figure 12-10. example of total wet stock report
290
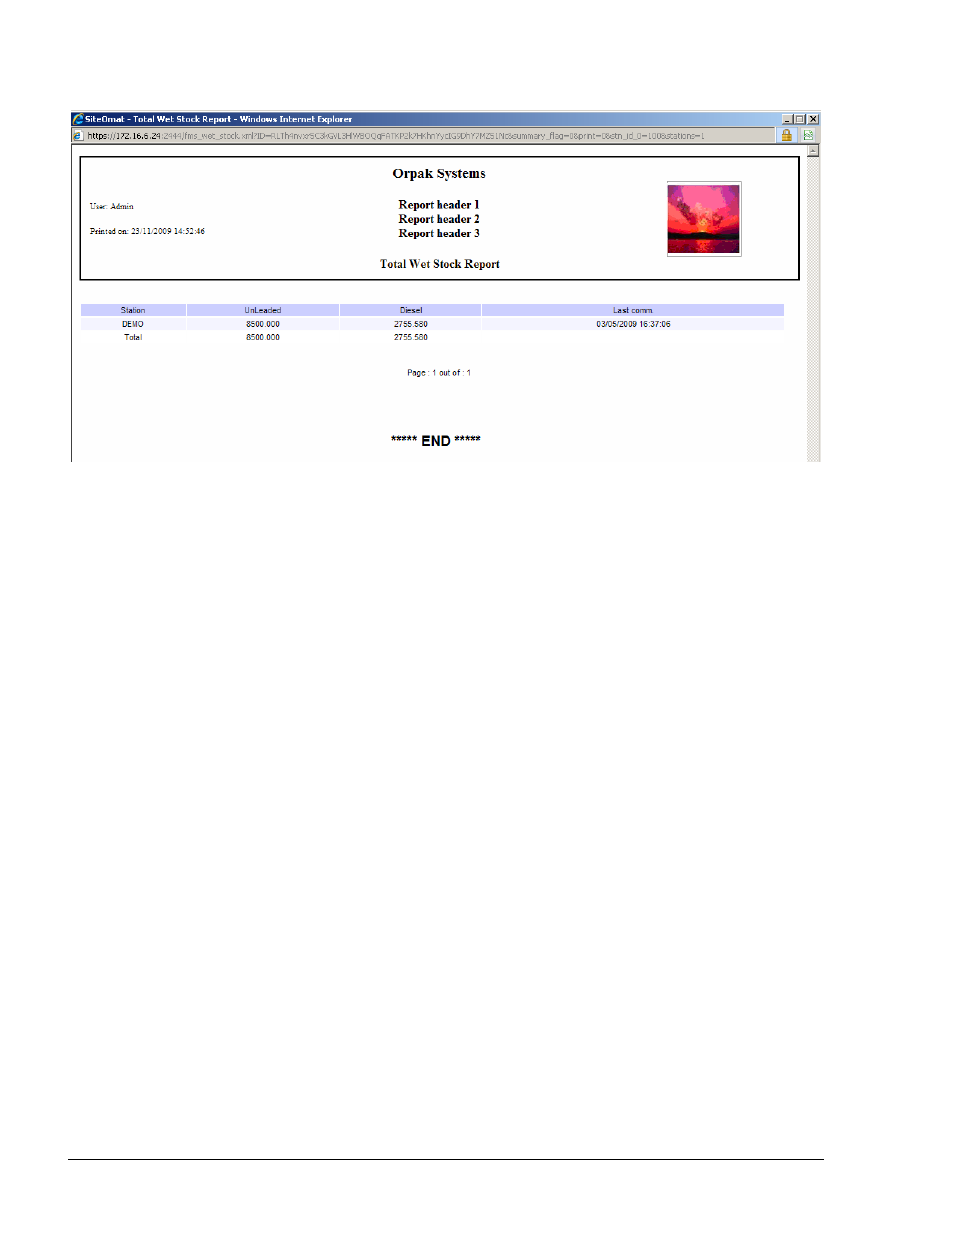
Figure 12-10. Example of Total Wet Stock Report
12.2.2.2. Tanks by Sites
This section enables the user to select a group of stations or a single station from the list at the
bottom part of the screen and generate a stock report detailed by tanks.
To print the report, select the stations to be included from the list located at the bottom part of the
screen. To select multiple stations, press the CTRL key and select the requested stations.
12.2.2.3. Tanks Trends Graph
The user can set the graph as a function of Fuel Level, Density and Temperature and a definable
date range (Start Date and End Date) for a specific station, using the drop-down menus on the upper
section of the screen. The user can select a specific tank or select all the tanks by clicking Select
All.
The graph's resolution can be defined in Hours, Days and Months and can be displayed in Bars or
Lines.
Marking the Show Values checkbox enables display of numerical quantities.
Clicking on the Refresh button enables the user to change the settings and produce the graph.
12.2.2.4. Daily Inventory by Fuel Type Report
This report enables the user to view the current fuel volume per fuel type in each station and each
tank.
The Station List is displayed on the bottom part of the screen. To filter the stations to be included in
the report, proceed as follows:
1. Select the checkbox next to the required Station
FMS and FHO User’s Manual - MDE-4821