Fuel sales trends graph, Figure 12-5. example of sales by product report – Gasboy Fleet Head Office System User Manual
Page 287

285
Table 12-4. Sales by Product Report Criteria
Field Name
Description
Transaction
Id
A unique ordinal ID number given by the
SiteOmat Station Controller to each transaction.
Nozzle
The nozzle number in the pump head, used to
supply the fuel in the transaction.
Transaction
Type
The type of transaction carried out.
Ref./Slip No. The slip number (or reference number).
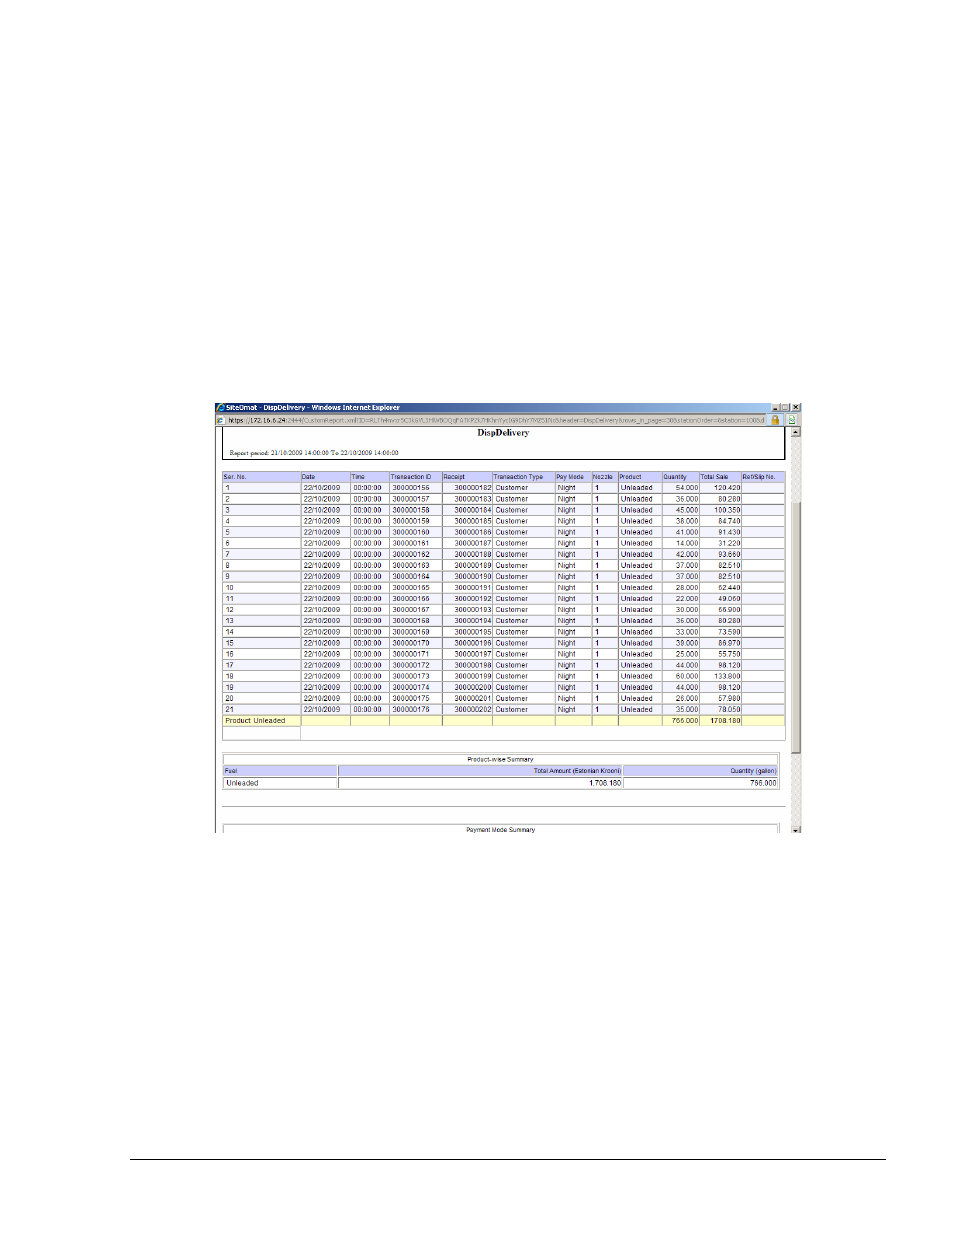
Click Preview. The relevant report is displayed, for example see Figure 12-5.
Figure 12-5. Example of Sales by Product Report
12.2.1.5. Fuel Sales Trends Graph
The user can set the graph as a function of Sales (Currency in use), or Volume (predefined
measurement unit) and a definable date range (Start Date and End Date) for a specific station, using
the drop-down menus on the upper section of the screen. The user can set specific Products, Tanks,
and Pumps as well (see Figure 12-6).
The graph's parameters can be defined in Hours, Days and Months and can be displayed in Bars or
Lines.
FMS and FHO User’s Manual - MDE-4821
