Fuel volume forecast report, Figure 12-6. reports, fuel sales trends graph – Gasboy Fleet Head Office System User Manual
Page 288
286
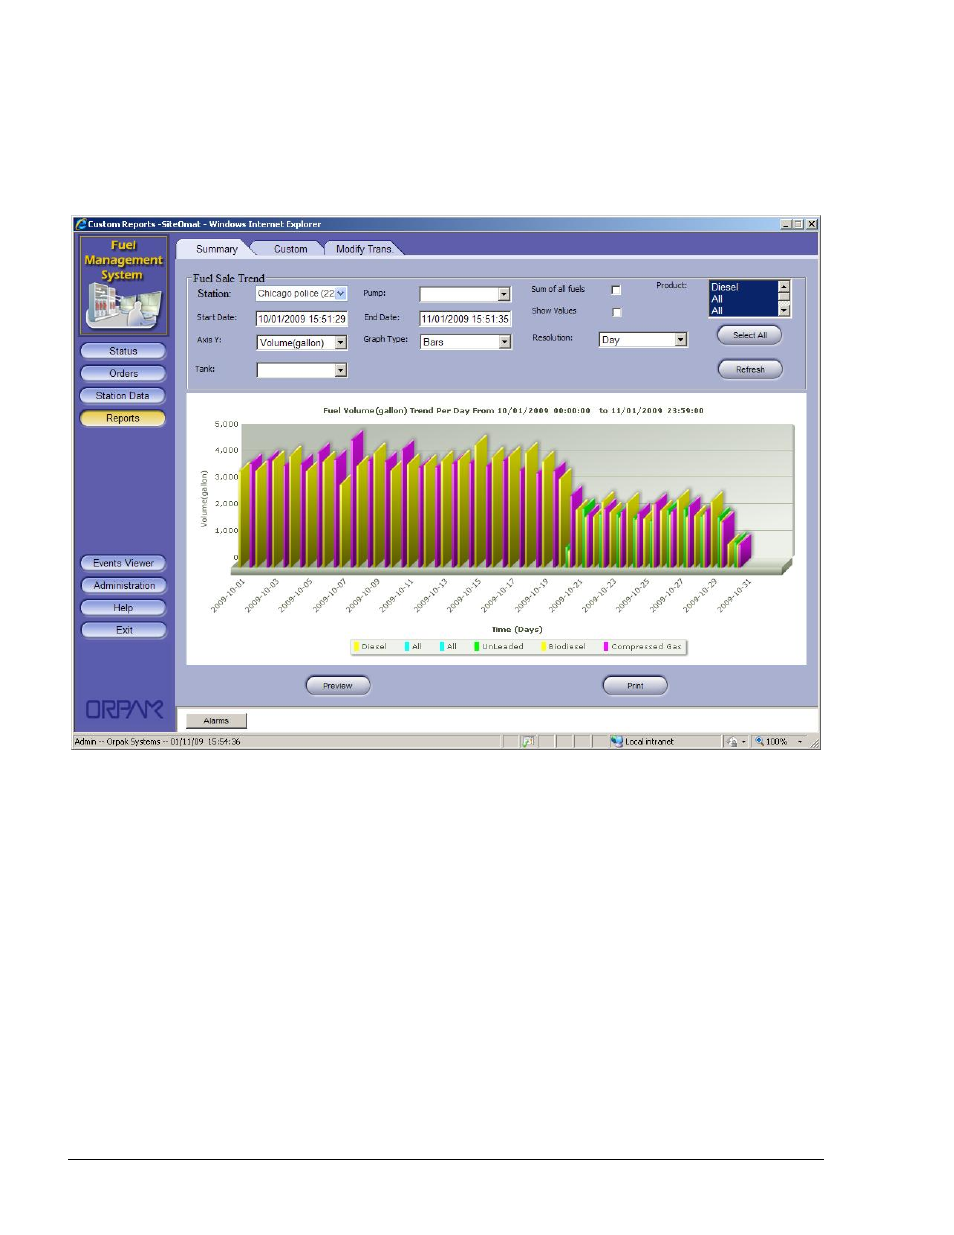
Checking the Sum of all fuels box displays the comparative graph between selected fuel types and
the Sum of all other fuels. Marking the Show Values checkbox enables display of numerical
quantities.
Clicking on the Refresh button enables the user to change the settings and produce the graph.
Figure 12-6. Reports, Fuel Sales Trends Graph
12.2.1.6. Fuel Volume Forecast Report
The Fuel Volume forecast Report screen provides the sales forecast of the requested fuel type.
The user can select the Month and fuel types so as to view the desired graph (see Figure 12-7). The
forecast is based on the following formula:
1. The user selects the option to view forecast for next month (For example: August 2010)
2. The system calculates last year's percent change for the equivalent month (For example:
July 2008 sales/August 2008 sales * 100)
3. The system adds the same percentage to the current month sales (For example: July 2010 +
diff percentage).
In new stations, the user can manually add the last year sales per month, per fuel type. See more
details in section 6.5.2.9.
FMS and FHO User’s Manual - MDE-4821