Luminex 100 IS Version 2.2 User Manual
Page 159
x
MAP Technology
Using Luminex 100 IS 2.2 Software
PN 89-00002-00-069 Rev. A
6 - 105
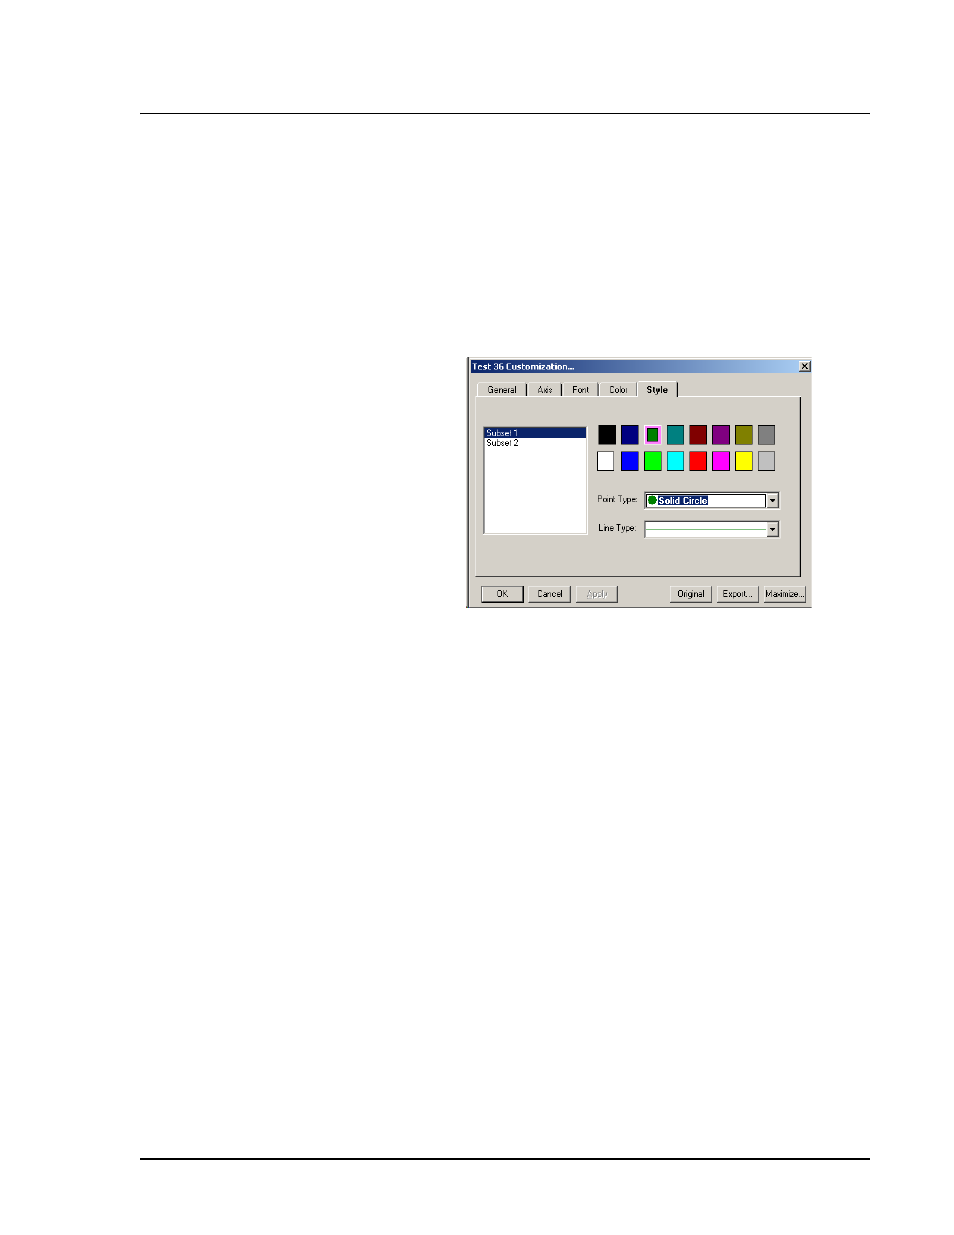
1. Select the desired subset in the Subsets list box. The
corresponding color and possible line and point types are
then highlighted in their respective controls.
2. To change the color, use the mouse to click an alternate
color or use the keyboard arrow keys to move to adjacent
colors. Adjust the subset line and point types as desired.
3. Click OK to update the graph’s image.
Figure 96. Customization Dialog Box—Style Tab
Graph Menu
Most of these menu items provide a shortcut for many of the features
provided in the Customization dialog box. Refer to “Customization
Dialog Box” on page 6-101 for details.
To modify the general features of graph representations of the
sample test result data:
1. Right-click anywhere in the graph on the Standards tab. The
graph menu appears. See Figure 97.