Dot plot – Luminex 100 IS Version 2.2 User Manual
Page 104
Luminex 100 IS User Manual Version 2.2
x
MAP Technology
6 - 50
PN 89-00002-00-069 Rev. A
Dot Plot
This section provides an overview of the Dot Plot. Details are
provided in the Luminex 100 IS Developer Guide for xMAP
Technology Version 2.2.
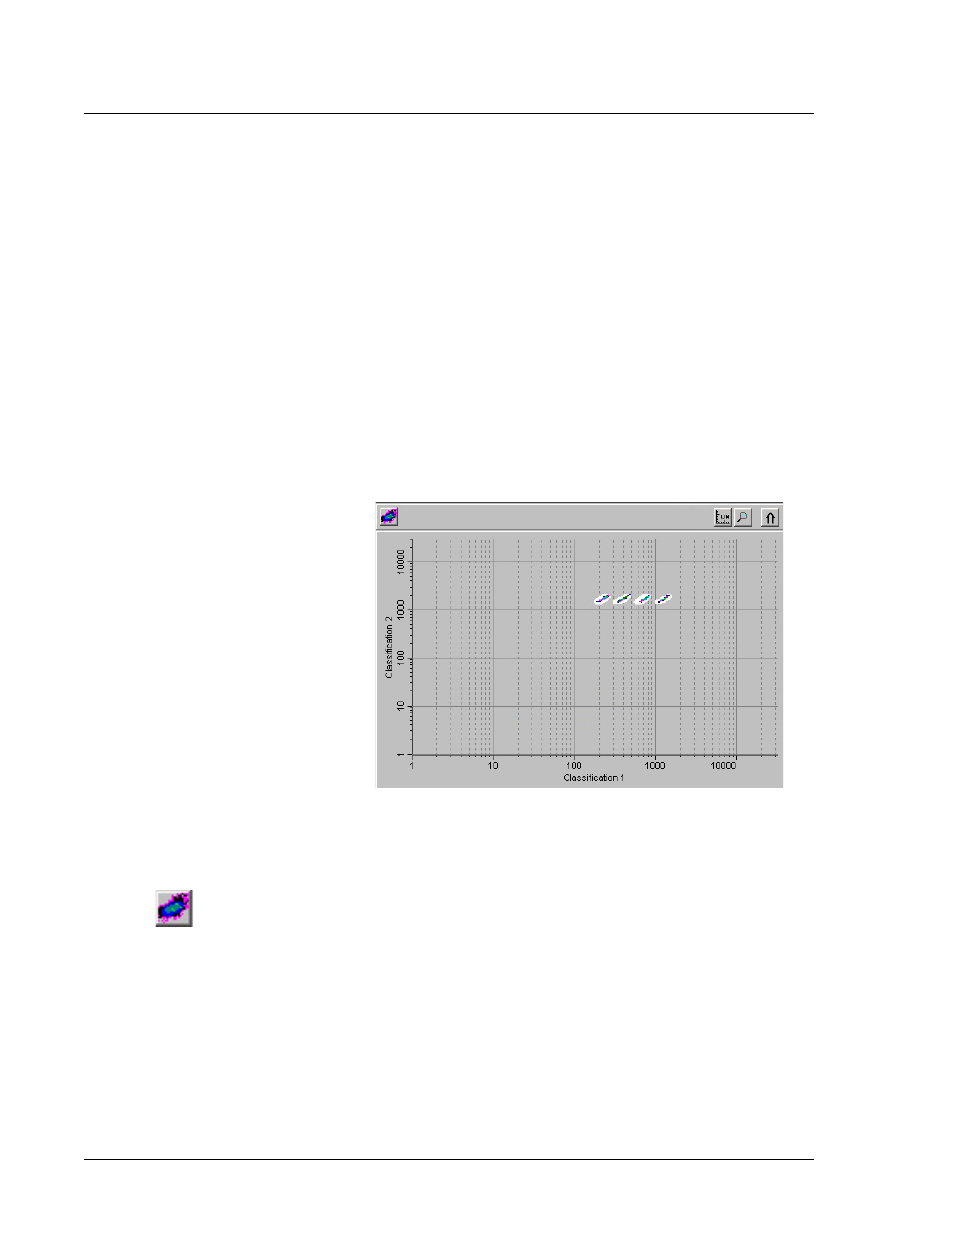
The Dot Plot (or bead map) appears in the lower-right section of the
Acquisition Detail tab. See Figure 50. The dot plot shows a graphical
display of real-time data collection as a dot plot. You may define the
X axis and Y axis scales from within the dot plot.
Luminex recommends using the default settings to collect data. The
default axis are Classification 1 on the X axis and Classification 2 on
the Y axis. To see the dot plot, you must use the default axis. To
display the bead set information, hover the mouse pointer over the
desired region and click.
Figure 50. Dot Plot Display Example
Dot Plot Buttons
Four buttons appear at the top of the frame to control the display:
Density/
Decaying
Select to toggle between the default density dot plot and the decaying
dot plot views.
The Decaying Dot Plot plots only the 100 most-recent acquired
events.
Note:
You may want to
change the X axis and Y
axis of the dot plot for
troubleshooting purposes.
Luminex recommends using
the default settings in all
other scenarios.