Samples tab – Luminex 100 IS Version 2.2 User Manual
Page 151
x
MAP Technology
Using Luminex 100 IS 2.2 Software
PN 89-00002-00-069 Rev. A
6 - 97
Samples Tab
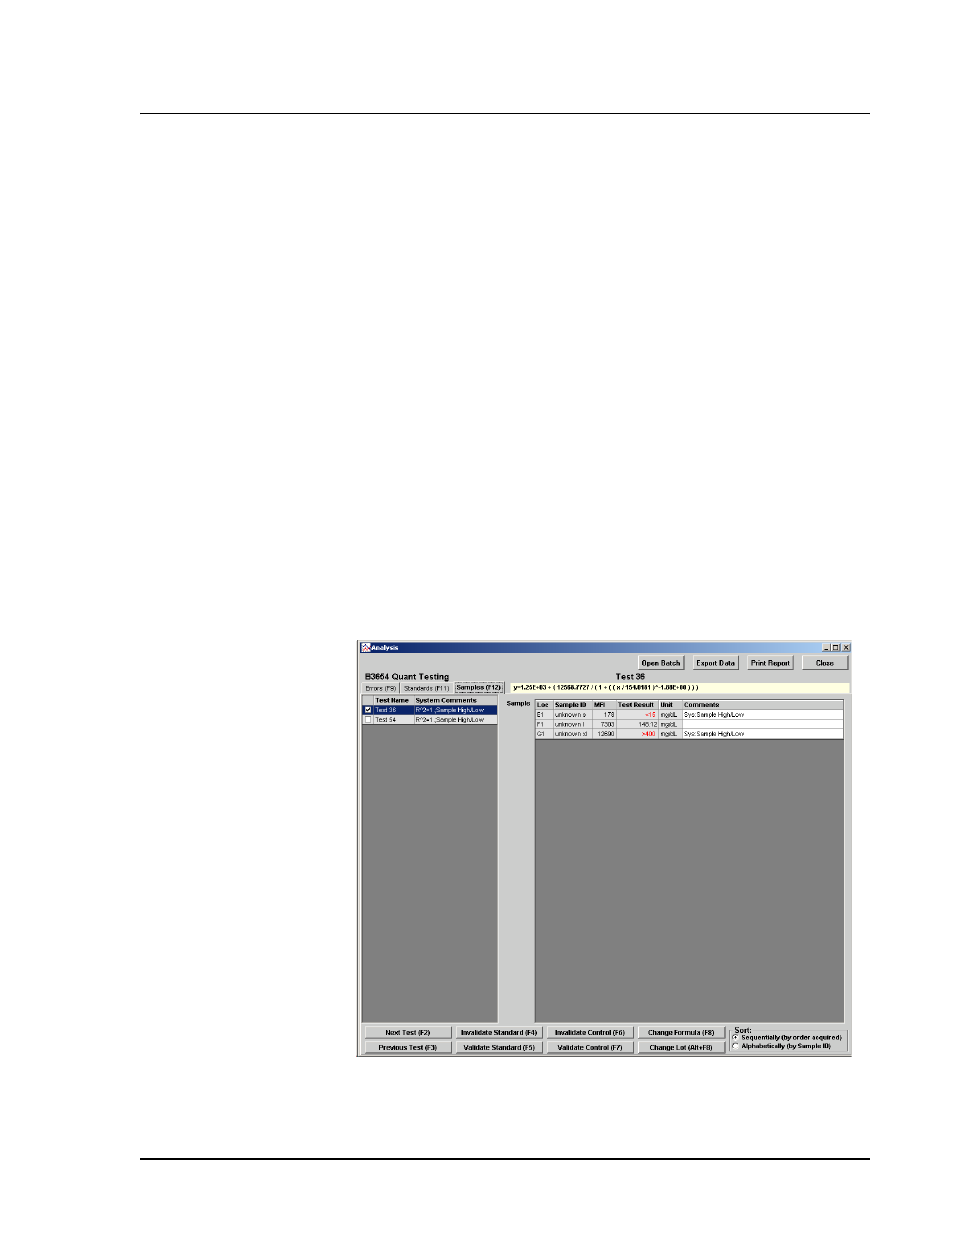
The Samples Tab lists tests from your batch and displays the results
for each sample.
Figure 88 shows a Sample tab example listing two tests. Notice that
the left column displays Test 36 and 54 with Test 36 selected. The
Sample column on the right side shows the Test 36 sample results.
Notice that the first sample “unknown s” test result is “<15”, because
this sample has an MFI less than the lowest standard in the standard
curve for this batch (Figure 82 shows the Standards Tab and the
lower standard with an MFI of 1405 and a 15 mg/dL test result).
Also notice that the third sample indicates a test result of “>400”.
This occurs because the MFI for this test is greater than the highest
standard in the standard curve. Notice that the associated Comments
column for the first and third sample indicate a sample out of range
error “Sample High/Low”. The second sample is within the standard
curve range and thus displays an unflagged test result.
The system does not flag results as normal or abnormal according to
a defined range. Error flags only note samples that fall below or
above the standard curve.
Figure 88. Analysis Window—Samples Tab
Note:
The Comments column
fields are editable and the
information is displayed in
reports.