Customize data analysis settings – Luminex 100 IS Version 2.2 User Manual
Page 154

Luminex 100 IS User Manual Version 2.2
x
MAP Technology
6 - 100
PN 89-00002-00-069 Rev. A
View Detailed
Error Information
To view error details during acquisition:
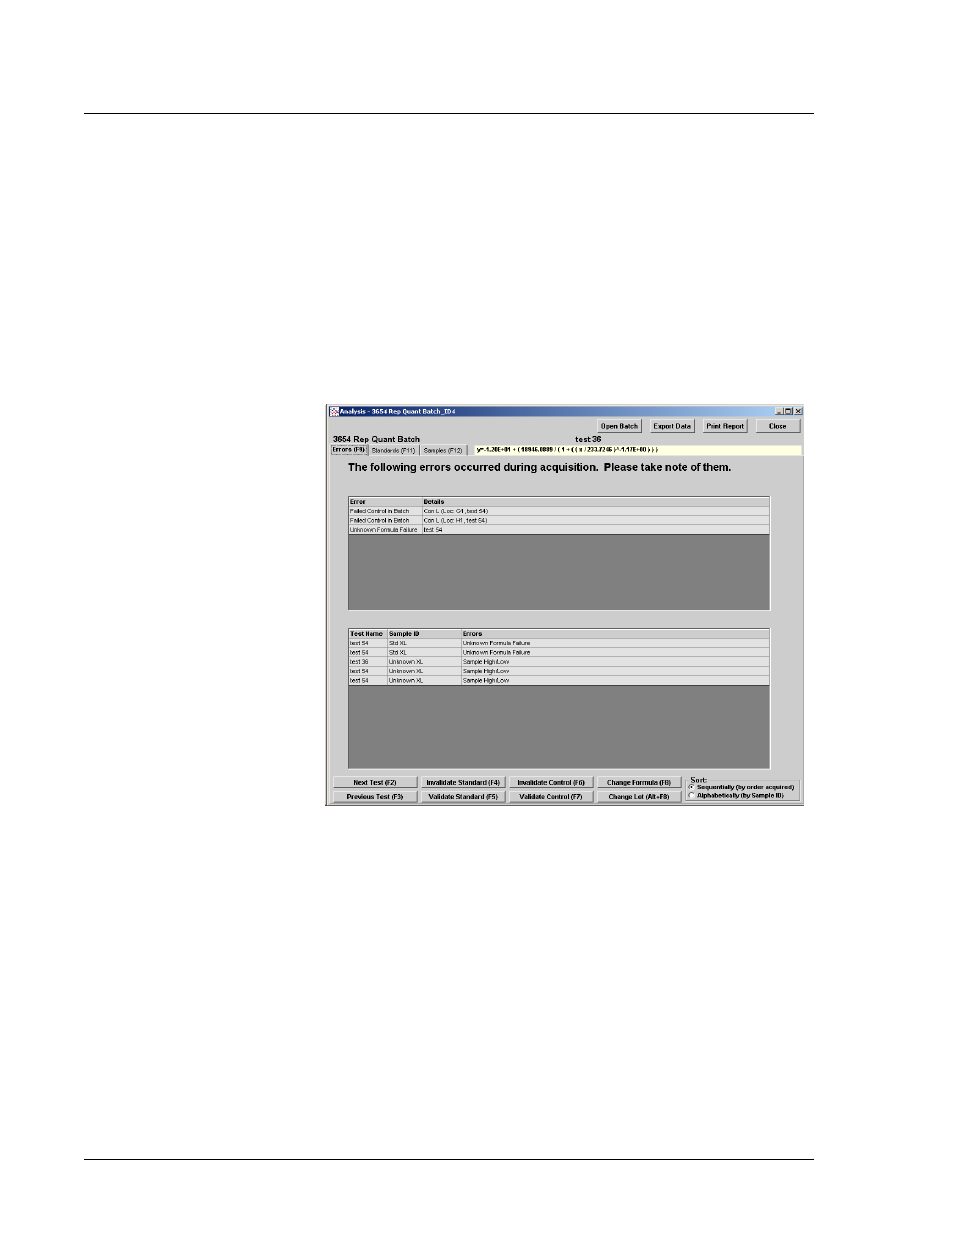
1. At the Analysis window, click the Errors tab.
2. The top half of the screen displays system and assay related
error. The name of the error and a detailed description is
displayed. See Figure 90 and Table 6.
3. The bottom half of the screen displays sample related errors. The
error is displayed as Test Name, Sample ID, and Errors. See
Figure 90 and Table 6.
Figure 90. Analysis Window—Errors Tab
Customize Data Analysis
Settings
You can customize how the sample data results are displayed in the
analysis graph on the Standards tab. There are two options that allow
you to customize the display. Use the Customization dialog box and
the Graph Menu items; some items are available on both. You can
define the general features of the graph, axis settings and increments,
fonts, colors, and styles presented in the graph representing the
sample data results. You also can export the analysis to a graphic,
file, clipboard, and so on.
