Luminex 100 IS Version 2.2 User Manual
Page 105
x
MAP Technology
Using Luminex 100 IS 2.2 Software
PN 89-00002-00-069 Rev. A
6 - 51
The Density Dot Plot displays a constant accumulation of events.
Increasing density is indicated by contrasting colors. See Table 5 for
the density dot plot color legend.
To change density plot options:
1. Right-click within the dot plot to display the drop-down menu.
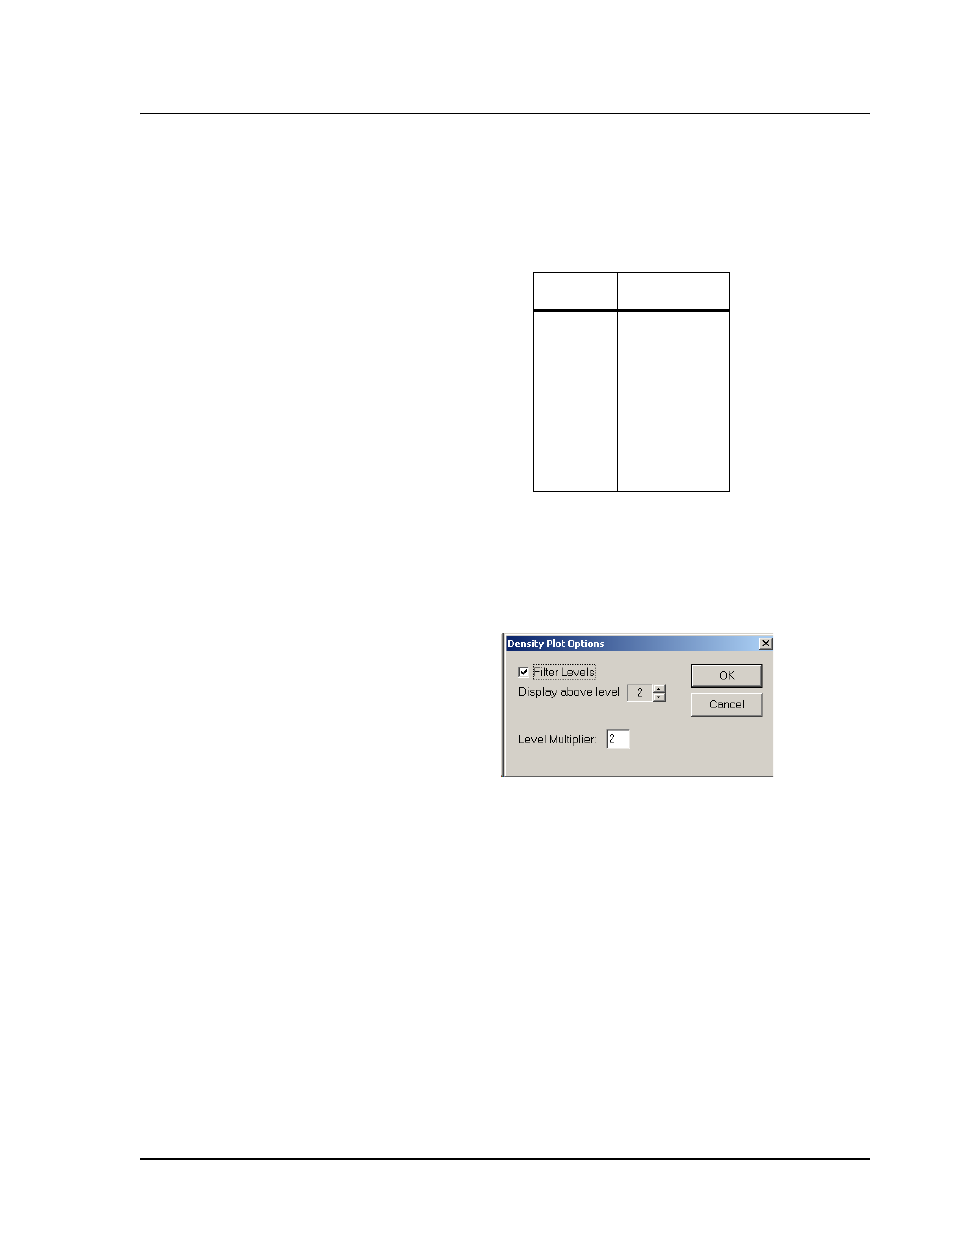
2. Click Options to display the Density Plot Options dialog box.
See Figure 51.
Figure 51. Density Plot Options Dialog box
3. Make the desired changes to the dialog box and click OK to
complete the operation. Refer to the following explanations for
additional information.
The density dot plot allows visual elimination of data values
determined to be insignificant to the display. The density options
apply only to the display of information—they do not affect the
collection of data or the corresponding data values.
Filter Levels: Use this checkbox to enable the filter levels feature.
Select this checkbox to filter out event accumulations that fall below
a certain density threshold. If you leave unchecked, then the Display
above level option is not available and the Level Multiplier has no
effect.
Table 5. Dot Plot Color Legend
Layer
Color
0
1
2
3
4
5
6
7
8
none
dark blue
pink
dark green
cyan
light blue
light green
orange
dark red