Luminex 100 IS Version 2.2 User Manual
Page 144
Luminex 100 IS User Manual Version 2.2
x
MAP Technology
6 - 90
PN 89-00002-00-069 Rev. A
•
samples
•
graph (this is the only way to print a graph of standards)
To print data analysis reports:
1. Click Analysis from the Home Tab.
2. At the Open Batch dialog box, select the desired batch to
analyze.
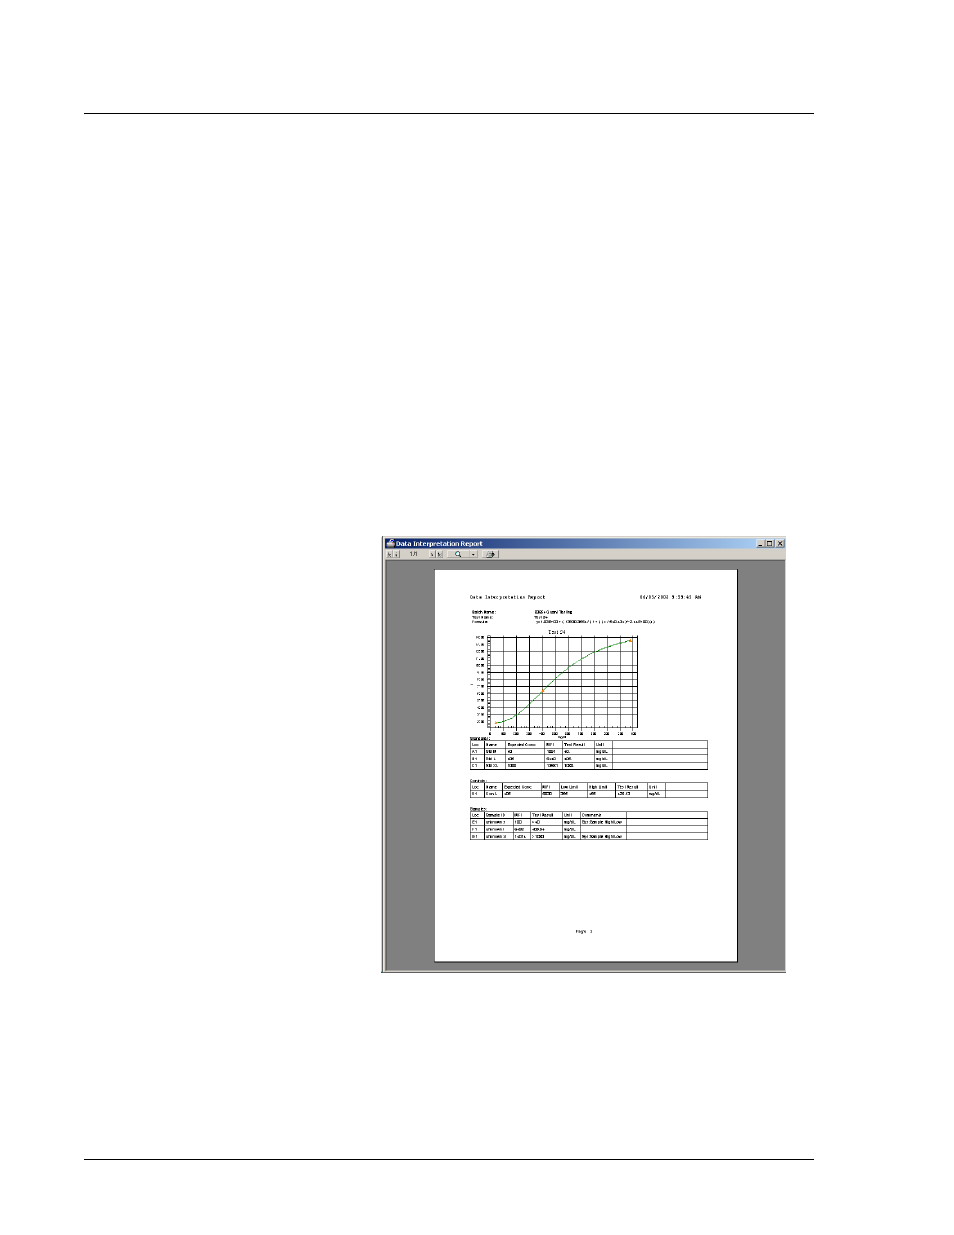
3. On the Analysis dialog box, select Print Report. The Data
Interpretation Report displays a print preview. See Figure 81.
4. Select any print options along the title bar and then click the
print button (printer icon).
5. At the Microsoft Windows Print dialog box select your printer,
options, and click Print.
Figure 81. Data Interpretation Report (Print Preview)
View Detailed Test
Analysis
To view detailed test analysis:
1. Click Analysis from the Home tab. An Open Batch dialog box
appears.