Metrohm tiamo 1.3 Manual User Manual
Page 802
776
Configuration
Note
This parameter is not saved on the datachip of intelligent exchange/dosing units,
i.e. this parameter will be empty if the data are written into the solutions table
from the IEU/IDU.
History graph
The graph shows the last 10 titer values for the selected solution. The titer values
are shown in different colors in the history table:
- Blue, if the titer has been determined automatically by a method.
- Black, if the titer has been entered manually.
If limits have been defined then the warning limits will be shown in orange and the
intervention limits in red.
Note
The history graph can be copied into the clipboard by using the context-
sensitive menu item
Copy
.
Opens the dialog window
Limits for titer
, in which the warning and interven-
tion limits can be defined for the titer. These limits apply only to the graph,
no monitoring is carried out during the titer determination.
Deletes titer history.
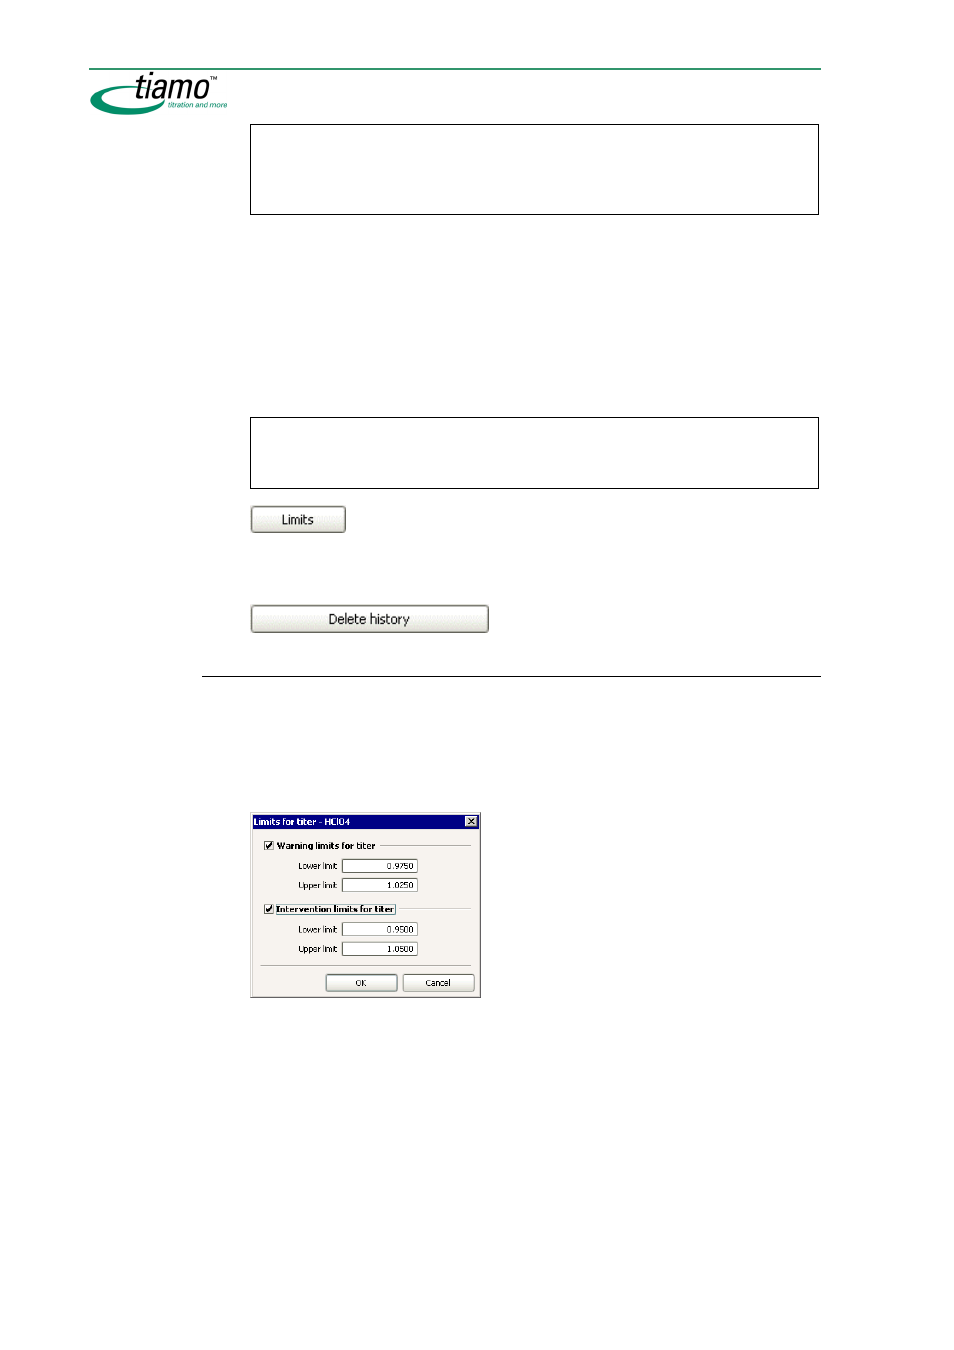
Titer history - Limits
In the dialog window
Limits for titer
warning and intervention limits can be defined
for the titer. If you have defined limits then these will be shown in the graph in or-
ange for warning limits and red for intervention limits. Whether these limits are
observed is not monitored, i.e. if the limits are infringed no action will be taken and
these solutions can be used in determinations.
Warning limits for titer
on, [ off ]
If this option is switched on then the titer value will be shown in orange if
this limit is infringed.
Lower limit
10 numbers, [ 0.9750 ]
Lower warning limit.
Upper limit
10 numbers, [ 1.0250 ]
Upper warning limit.