4 properties – Metrohm tiamo 1.3 Manual User Manual
Page 298
272
Database
4.11.4 Properties
The properties for the display of curves can be set on the following 5 tabs:
•
x Axis
Parameters for the graphical presentation of the graph on the x-axis.
•
y1 Axis
Parameters for the graphical presentation of the graph on the y1-axis (left-
hand y-axis).
•
y2 Axis
Parameters for the graphical presentation of the graph on the y2-axis (right-
hand y-axis).
•
Options
Options for the graphical presentation of the curves.
•
Measuring point list
Parameters for showing the measuring point list.
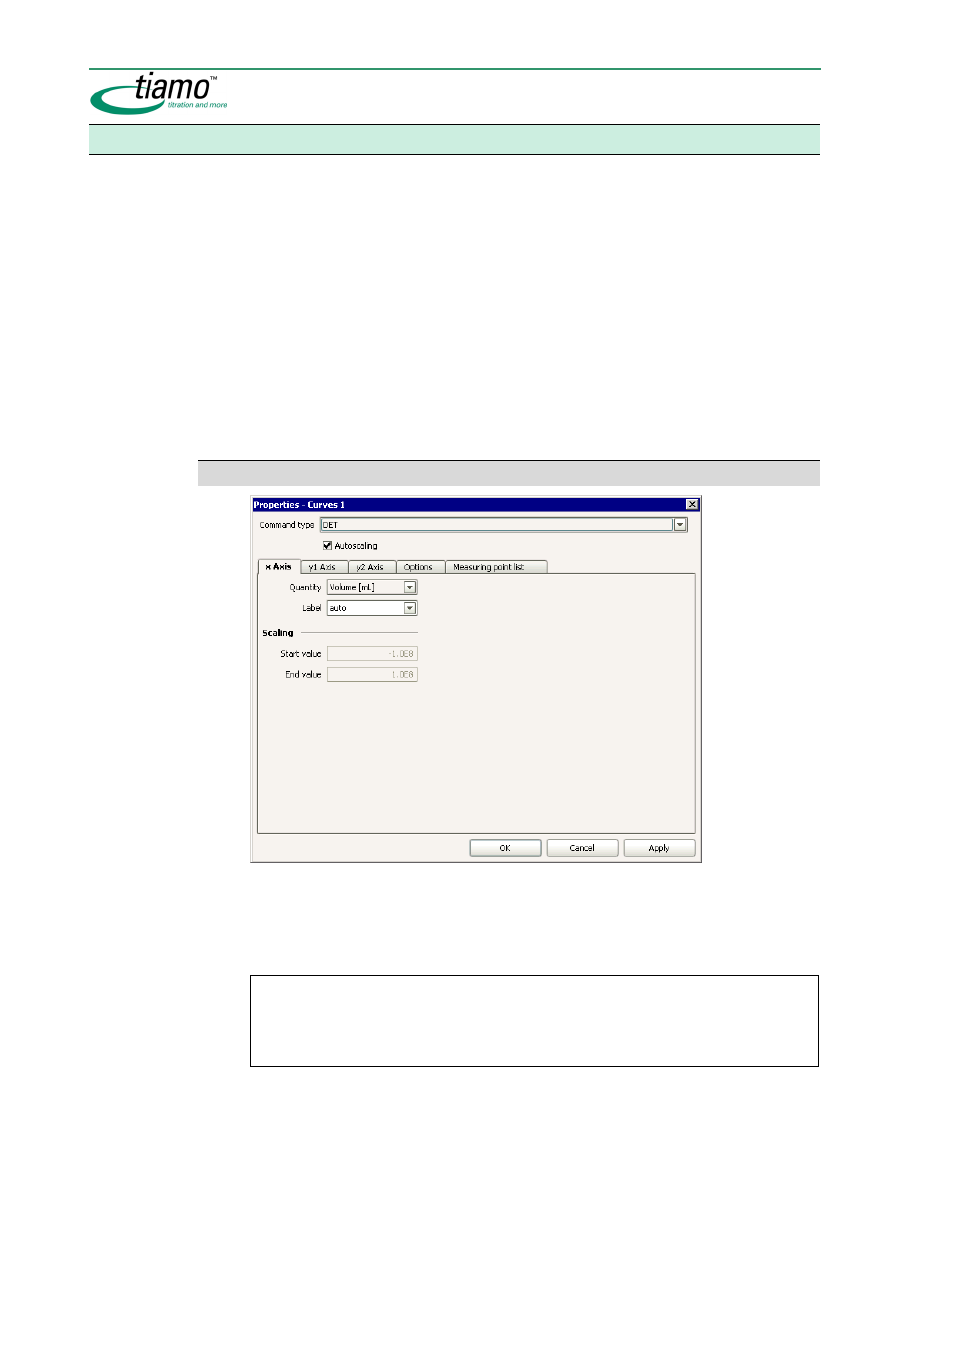
x Axis
Command type
[ DET ], MET, SET, KFT, KFC, STAT, MEAS, MEAS T/Flow, DOS
Selection of the command type for which the curve properties are to be de-
fined. The curve properties defined per command type are saved per curve
window and per client.
Note
When the dialog window is opened the particular
Command type
that will be se-
lected as standard is that which applies for the curve shown in the curve win-
dow.
Autoscaling
[ on ], off
If this option is switched on then all axes in the curve window will be scaled
automatically. In this case the fields
Start value
and
End value
cannot be ed-
ited.