Metrohm tiamo 1.3 Manual User Manual
Page 279
Subwindow Determination overview
253
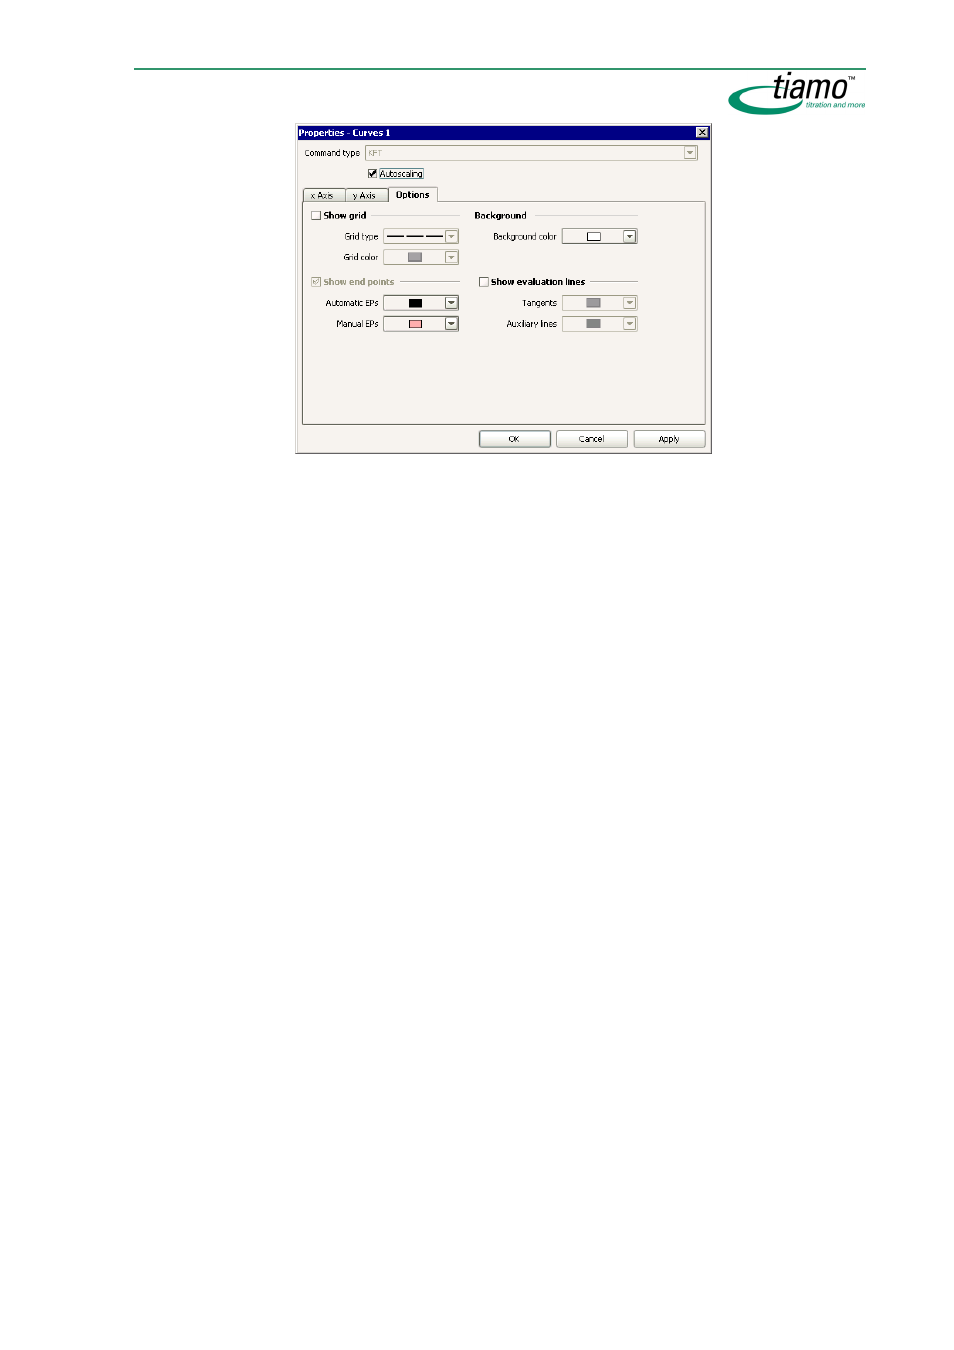
Command type
[ DET ], MET, SET, KFT, KFC, STAT, MEAS, MEAS T/Flow, DOS
Shows the type of command for which the curve properties can be defined.
The curve properties defined by command type for the reprocessing win-
dow are saved per client.
Autoscaling
[ on ], off
If this option is switched on then all the axes in the curve window will be
scaled automatically.
Show grid
on, [ off ]
If this option is enabled then a grid will be shown against the background.
Grid type
Select line type
Selection of the type of grid line.
Grid color
Color selection, [ dark gray ]
Selection of the color for the grid lines.
Background
Background color
Color selection, [ white ]
Selection of the color for the curve background.
Show end points
on, [ off ]
If this option is enabled then the end points found will be shown on the
curve by the symbol
♦
and labeled with
EP#
(potentiometric end point),
BP#
(break point),
FP#
(Fixed end point),
HP
(HNP),
MI
(minimum value) or
MA
(maximum value).
Automatic EPs
Color selection, [ black ]
Selection of the color for automatically set end points.
Manual EPs
Color selection, [ light red ]
Selection of the color for manually set end points.
Show evaluation lines
on, [ off ]