HP Storage Essentials NAS Manager Software User Manual
Page 584

Viewing Performance Data
552
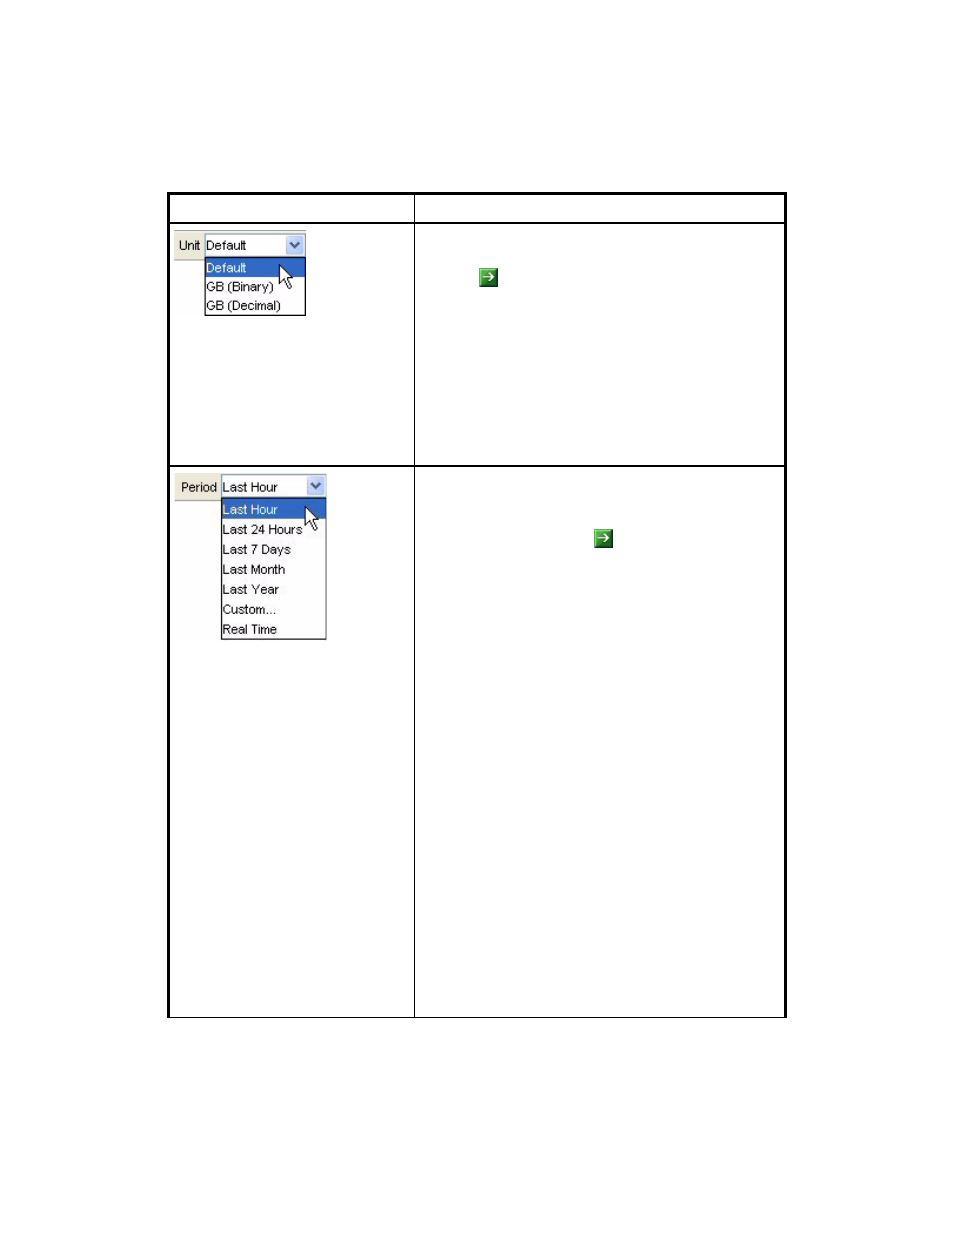
Lets you determine the unit of the measurement in the
graph. Select one of the following options and then
click the button for your selection to take effect:
•
Default
- Displays the data in its default unit,
which is usually megabytes.
•
GB (Binary)
- Displays the data in gibibytes,
which is a binary unit of measurement. The
computer handles the data in binary format. A
gibibyte is equal to 1,073,741,824 bytes.
•
GB (Decimal)
- Displays the data in gigabytes. A
gigabyte is equal to 1,000,000,000 bytes.
Lets you format the graph to provide data within the
time period specified. Select the option to the left of
the Period combo box. Select one of the following
options and then click the button for your selection
to take effect:
•
Last Hour
- Information collected in the last hour
is reported. If you select Last Hour, the only
frequency available is Default.
•
Last 24 Hours
- Information collected in the last
24 hours is reported.
•
Last 7 Days
- Information collected in the seven
days is reported.
•
Last Month
- Information collected in the last
month is reported.
•
Last Year
- Information collected in the last year is
reported.
•
Custom
- Lets you created custom settings for the
graph.
•
Real Time
- Displays the data as it is currently
being gathered by the management server. The
summary chart is the default chart for all real time
performance display. If you select Real Time, the
only frequency and unit available is Default.
To set a custom period, select the Custom option.
See ”
” on page 556 for more
information.
Table 131
Toolbar in Lower Pane of Performance Manager (continued)
Icon
Description
- Storage Essentials Report Designer Software Storage Essentials Enterprise Edition Software Storage Essentials Provisioning Manager Software Storage Essentials Chargeback Manager Software Storage Essentials Backup Manager Software Storage Essentials Global Reporter Software Storage Essentials File System Viewer Software Storage Essentials Exchange Viewer Software BladeSystem p-Class Power Distribution
