Data display parameter descriptions – MTS Series 793 Application User Manual
Page 441
Data Display Process
MTS MultiPurpose TestWare®
Other Process Descriptions
441
Data Display Parameter Descriptions
Plots tab
This window lets you create, delete, and rearrange plots using its toolbar icons.
Note
To save the position of the plot window(s), you must save the procedure
(’position’ refers to the location of the plot on your PC monitor). If you
move the plot window from its default position and close the procedure
without saving, the plot window will appear in its default (or last saved)
position.
Data display plot setup
tab
This window lets you customize the axes for each plot. Characteristics for each
plot are defined separately. Plot characteristics are specified on four tabs: X-Axis,
Y1-Axis, Y2-Axis, and Options.
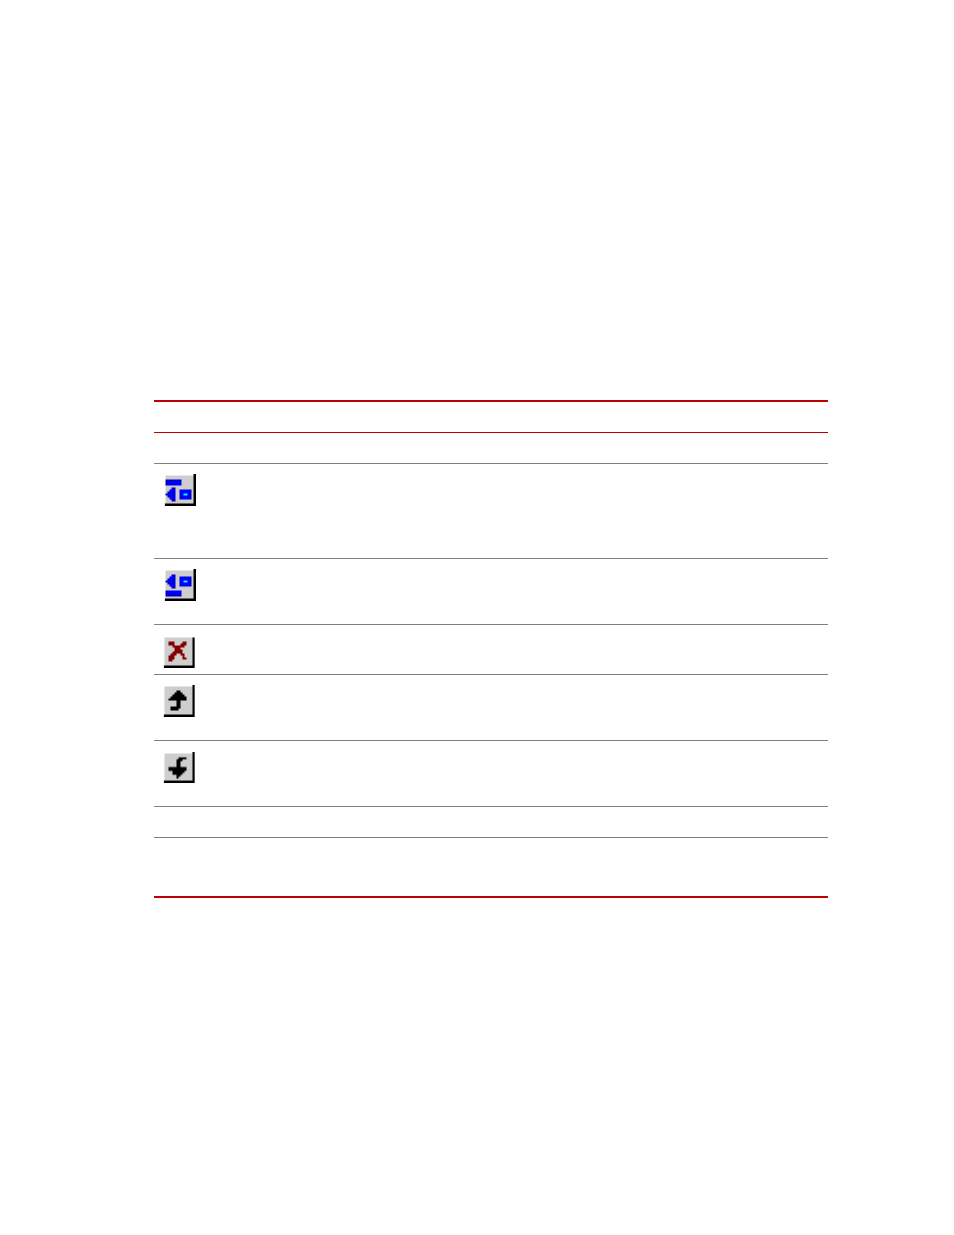
Plots Tab
I
TEM
D
ESCRIPTION
Plots
Displays the Data Display process toolbar and your current plots.
Add/Add after
selection
Creates a new plot.
When the Plots list is empty, this button is labeled “Add”. Once an item has
been added, it changes to “Add after selection.” If you select a plot and then
click this button, a new plot will be added after the selected item.
Add before
selection
Adds a new plot before the selected item.
Delete selection
Deletes the selected plot.
Move selection
up
Moves the selected plot up one position.
Move selection
down
Moves the selected plot down one position.
Plot Title
Specifies the plot window title.
Plot Enabled
Displays the plot when the test is run.
Note
Only plots that are enabled are displayed on-screen during the test.