Rangemean histogram – MTS Series 793 Application User Manual
Page 321
Fatigue Process
MTS MultiPurpose TestWare®
Data Acquisition Process Descriptions
321
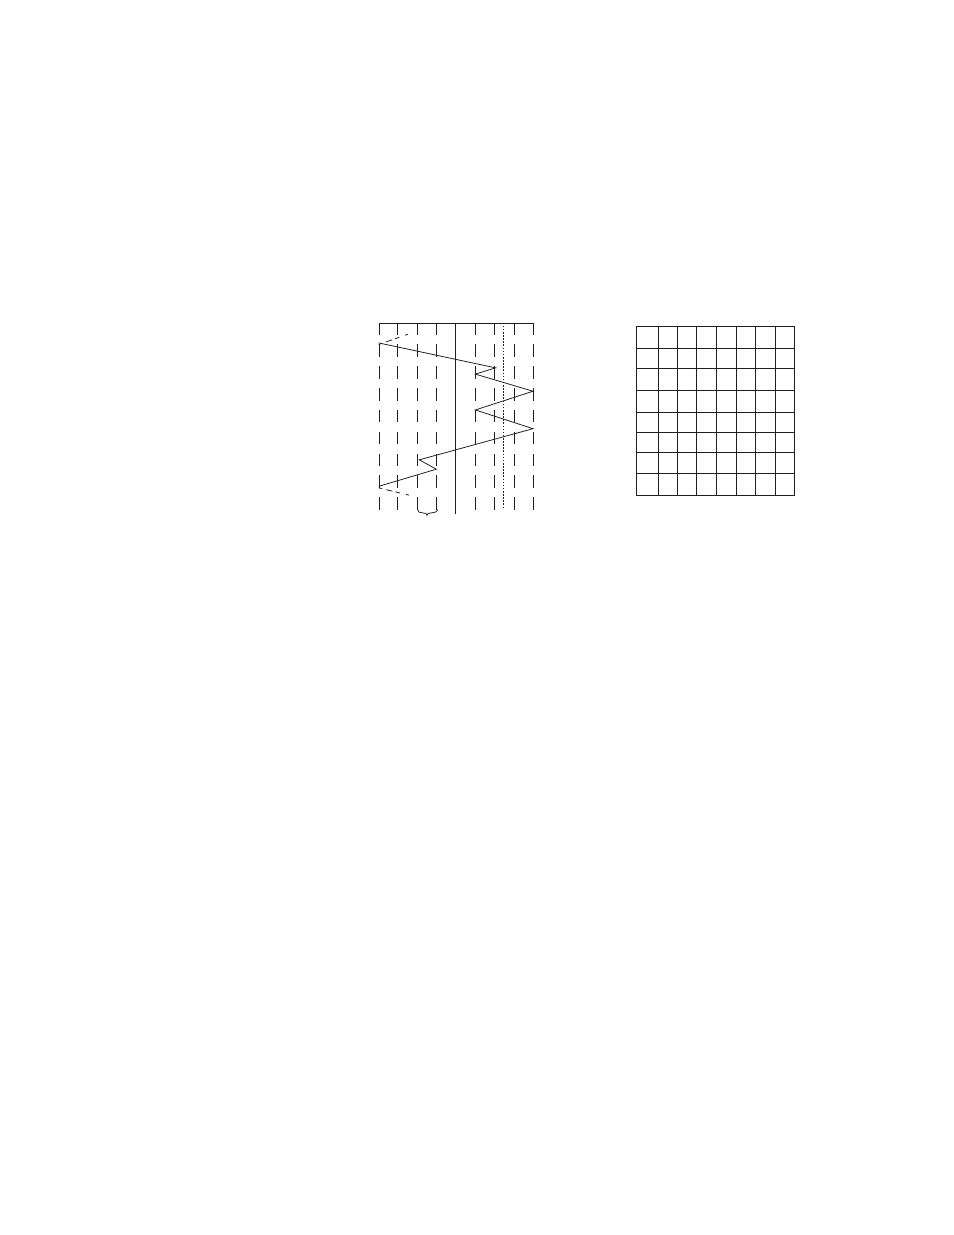
RangeMean histogram
The RangeMean histogram identifies the range and the mean of each cycle
identified by the rainflow-counting method. The following example illustrates
the method for creating a RangeMean histogram.
The closed cycles and their associated range and mean are:
•
BC—Range of 1; Mean of 1.5
•
DE—Range of 3; Mean of 2.5
•
FG—Range of 1; Mean of –1.5
•
AD—Range of 8; Mean of 0.0
A
B
C
E
F
G
A
D
D
Time
Range
(FG)
Mean
(DE)
-3 -2 -1 0 1 2 3
-4
4
Strain (ε)
Range ( ε)
Mean (
ε)
-3
-2
-1
0
1
2
3
4
0 1 2 3
4 5 6 7 8
-4
BC
DE
FG
AD
This manual is related to the following products: