Range histogram, Bins, Bin size – MTS Series 793 Application User Manual
Page 323: Lower range, Upper range
Fatigue Process
MTS MultiPurpose TestWare®
Data Acquisition Process Descriptions
323
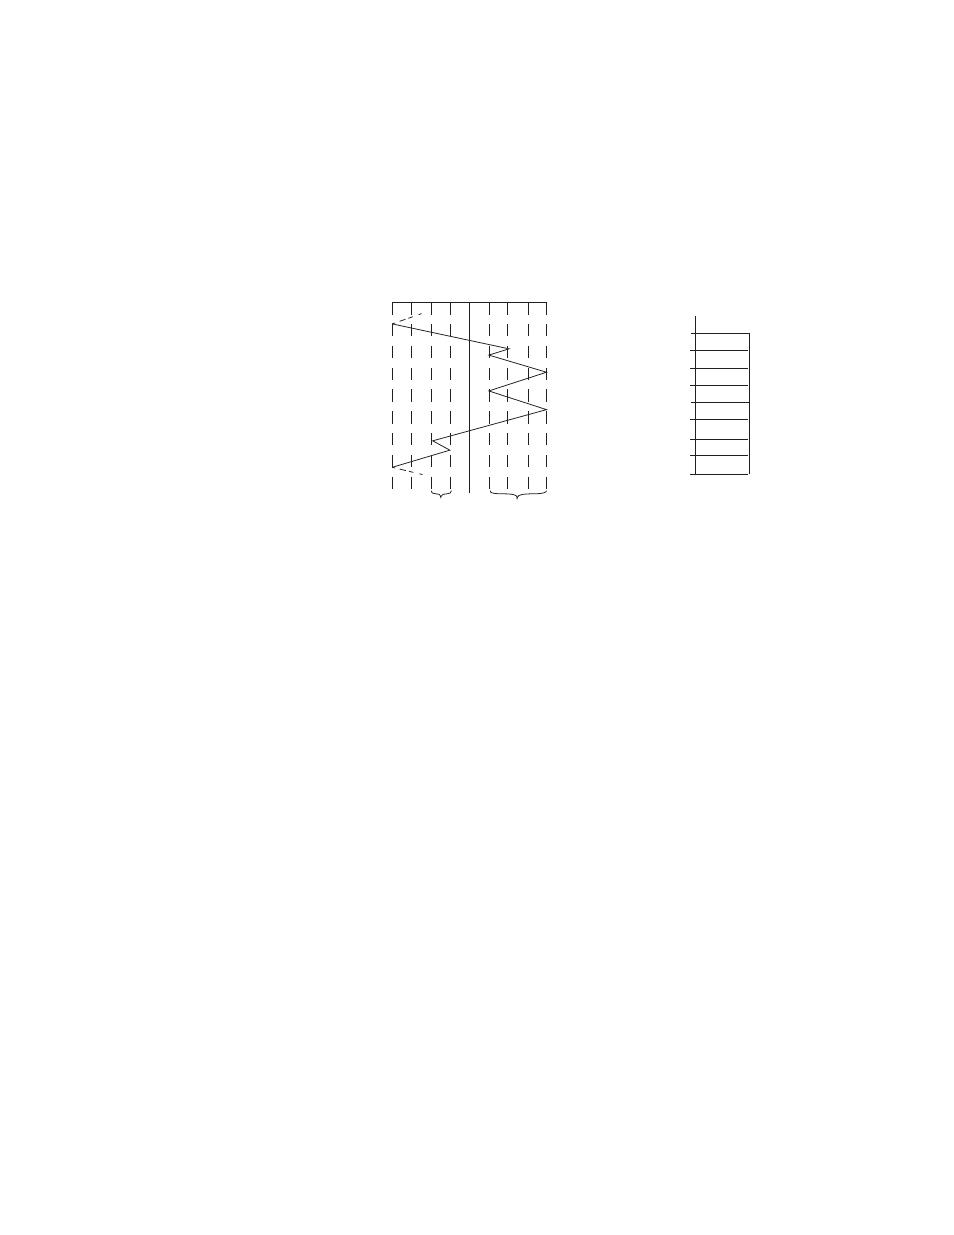
Range histogram
This method identifies cycles only by the cycle range. The following example
illustrates the method for creating a Range histogram:
The closed cycles and their associated range values are:
•
BC—Range of 1
•
DE—Range of 3
•
FG—Range of 1
•
AD—Range of 8
Bins
Changing the bin size, lower range, upper range, or number will cause the other
numbers to change in order to maintain the following relationship:
Bin size
The bin size specifies the distance between each histogram bin boundary for the
selected channel.
Lower range
The lower range specifies the lower boundary of the histogram.
Upper range
The upper range specifies the upper boundary of the histogram.
A
B
C
E
F
G
A
Strain Time History
Time
-3 -2 -1 0 1 2 3
-4
Strain (ε)
D
D
4
Range
(FG)
Range
(DE)
Cycle
Count
1
2
3
4
5
6
7
8
1
2
1
Range (
ε)
BC, FG
DE
AD
0
Bin Size
Upper Range Lower Range
–
(
)
Number of Bins
---------------------------------------------------------------------------
=