Trend monitoring window, Trend monitoring window 460 – MTS Series 793 Application User Manual
Page 460
MTS MultiPurpose TestWare®
Model 793.12 Trend Monitoring Application
Trend and Fatigue Monitoring Applications
460
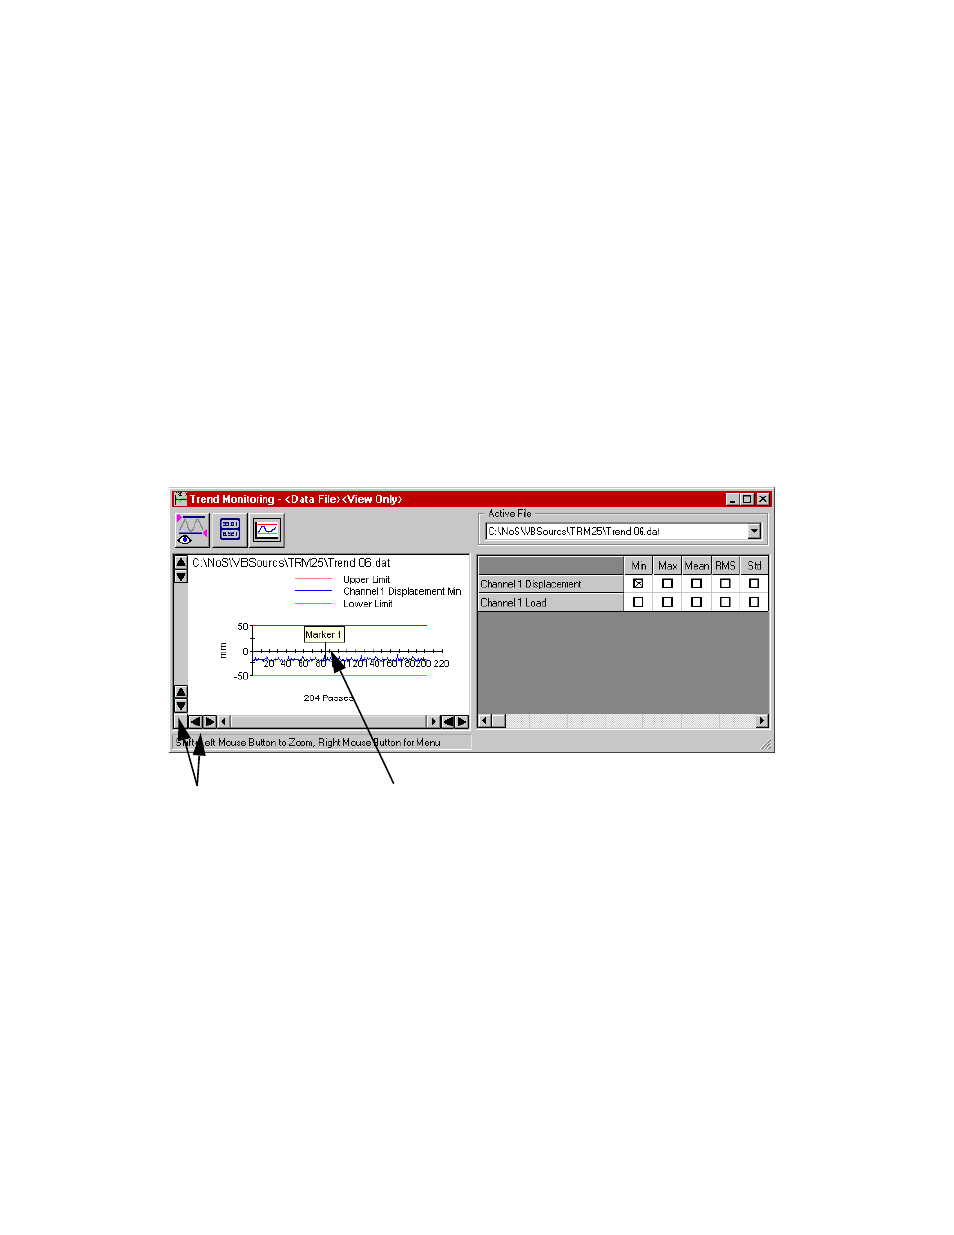
Trend Monitoring Window
The Trend Monitoring window consists of your trend plot, a channel selection
box, and a toolbar. If you are running a new procedure, the Procedure File View
displays. If you open an existing data file, the Data File View displays.
The current statistical values and the actual limit settings are displayed on the
data plot. If you are creating a new process, the system will plot only the first
channel in the list by default
Note
If just one statistical value has been plotted, and you have specified
limits, the limits are also displayed on the plot. If multiple values are
plotted, the limits are not displayed.
Data File View
Increase/Decrease
X/Y Min and Max
User-Defined Marker
Note
A left mouse-click on the trace will display it coordinates.