7 status and control, 1 parameter – Triton Isis User Manual
Page 277
June 2004 Isis® Sonar User's Manual, Volume 1
263
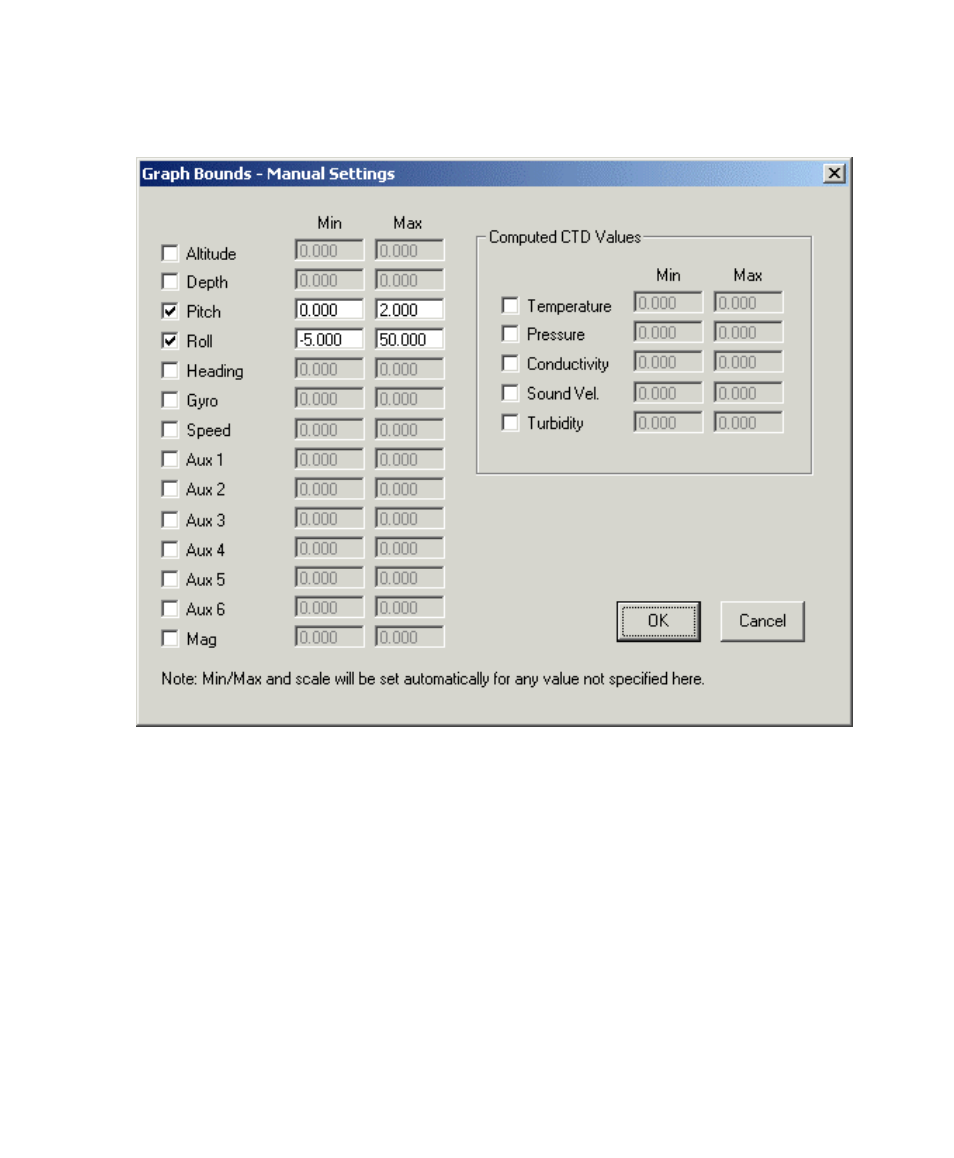
Figure 10-25: Graph Bounds dialog box for setting graph scales
manually
10.6.10 Clear Graph Between Data Gaps
If some of your data is discontinuous (has one or more breaks someplace in
the middle), you can have Isis reset your current graph displays to start
plotting fresh again, from the point were the data resumes after the break in
the data. Choose Window→Graph→Clear Graph Between Data Gaps to
achieve this.
Chapter 10: Using the Window Menu