4 coverage map and mosaic – Triton Isis User Manual
Page 177
June 2004 Isis® Sonar User's Manual, Volume1
163
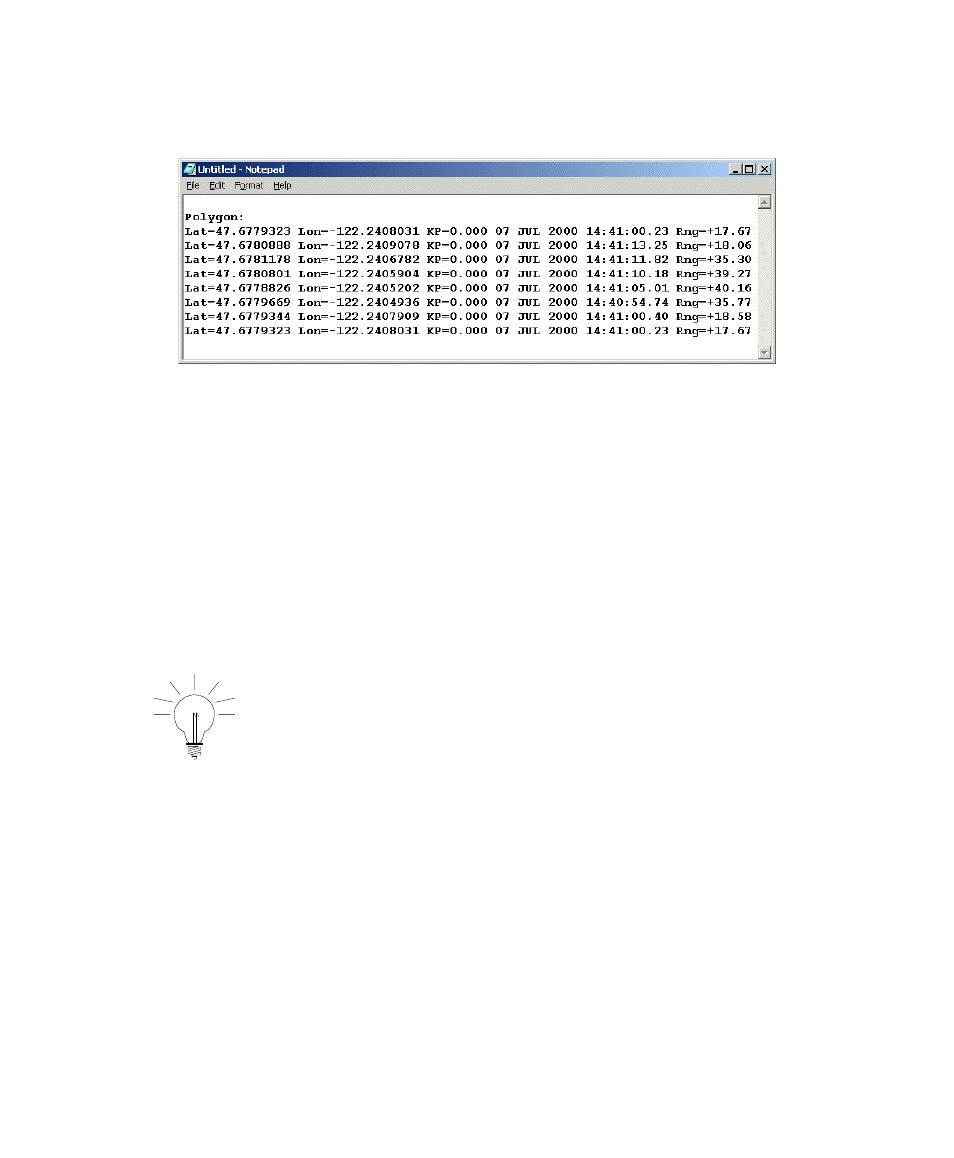
Figure 9-7: Sample ASCII report generated by Digitize Lines and
Polygons
9.4 Coverage Map and Mosaic
Choosing Coverage Map and Mosaic from the Tools menu provides a way to
make a visual map of a data survey and, optionally, of sensor coverage. When
active, the coverage map window updates each time the sensor’s navigation
position changes. You can make coverage maps in Record or Playback mode;
the coverage map display behaves identically in each mode.
If CPU time is not adequate for processing both data and the coverage display,
then portions of the coverage map may not be updated regularly, may appear
overwritten, or may be blank. The image is updated at the end of data
processing.
The following instructions assume that you have side scan sonar data recorded
in a Triton format, and that you are already familiar with the basic operation of
Isis.
There are two ways to make a mosaic in Triton software: a method that uses
Kalman filtering, and a method that uses the traditional coverage map technique.
The end result of either method is a .DDS_VIF file containing the sidescan
imagery and a .DDS_VOB vector file containing the vessel’s track.
The first part of this guide describes a new method that uses the Kalman filtering
technique. This is now the default method. The second part of this guide
Chapter 9: Using the Tools Menu