Grass Valley iControl V.6.02 User Manual
Page 131
iControl
User Guide
121
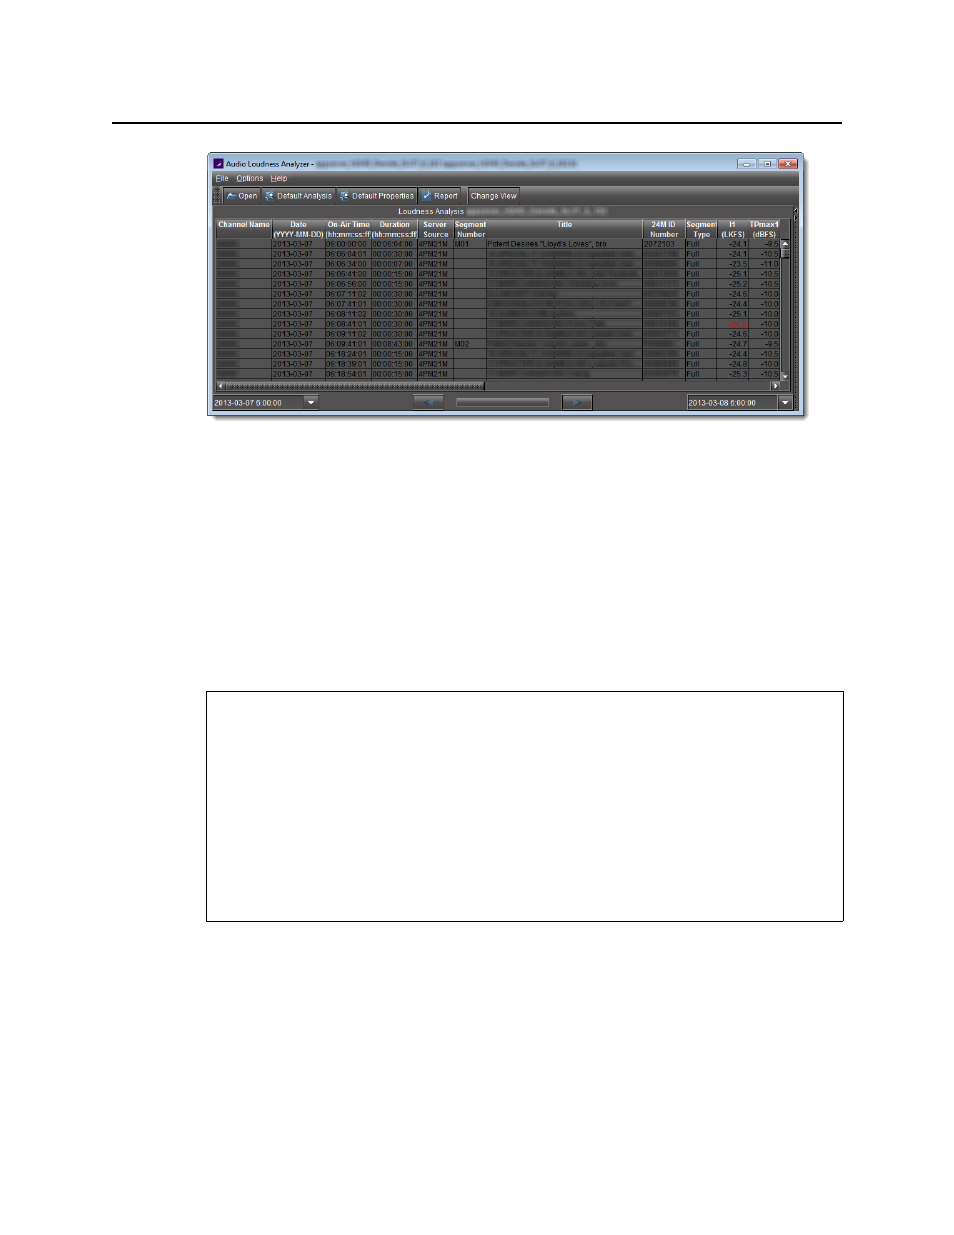
Tabular view of Audio Loudness Analyzer
Audio Loudness Analyzer is a powerful tool for graphically depicting an audio source’s
loudness data over a period of time. The power of this tool lies primarily in its configurability of
analysis parameters, including the applicable loudness standard, relative gating, and short-
term window. As well, Audio Loudness Analyzer allows you to zoom into a data plot. Each
zooming action triggers a new analysis of loudness data from source, for the requested time
period (configurable start and stop times) and given the configured analysis parameters.
Additionally, one can choose to incrementally display or hide plot series. For example, you
may decide to display only Short-term Momentary 1, Integrated Momentary 1, and DIALNORM
data while hiding the remaining series in order to unencumber the visual chart. See the
following figures for detailed views of Audio Loudness Analyzer:
See also
For more information about:
• Loudness logging and analyzing [descriptive information], see
• A sample workflow for loudness logging and analyzing, see
• Audio Loudness Analyzer [more detail] and loudness analysis [more detail], see the
Audio Loudness Analyzer User Manual, available by clicking Help in Audio Loudness
Analyzer.
• The use of
As-Run
log files for parsing discrete segments out of loudness data, see the
Audio Loudness Analyzer User Manual.