2 running a frequency response test – EXFO CableSHARK P3 VF/DSL Cable Qualifier User Manual
Page 86
VF / DSL Cable Qualifier
74
8.1.2 Running a Frequency Response Test
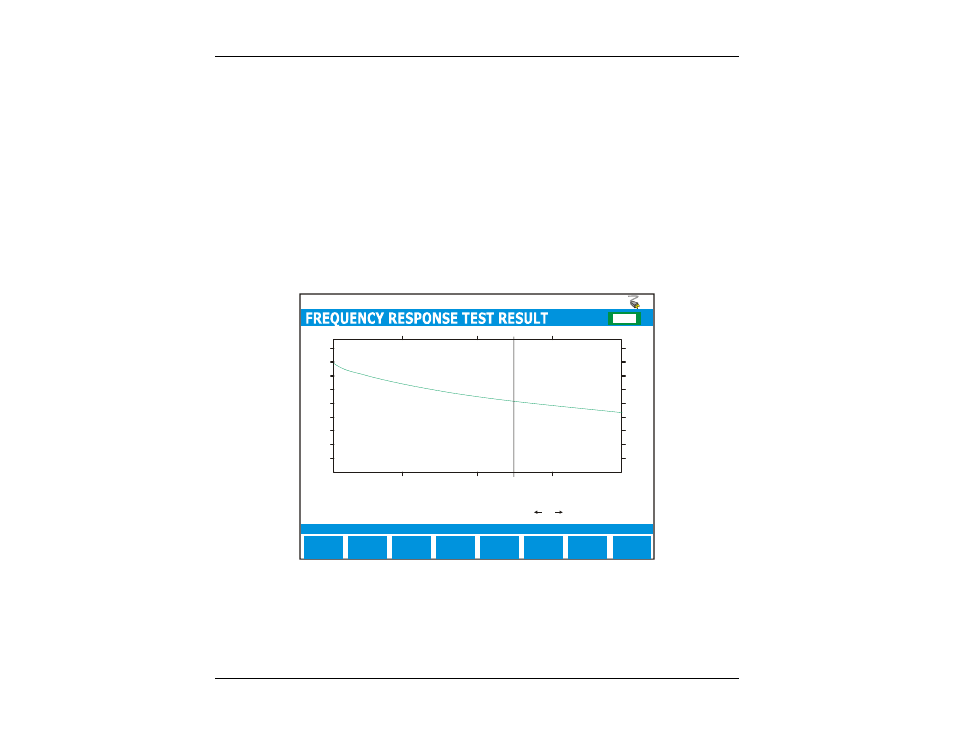
Once the test is set up, press the RUN/STOP key located on the front panel of the CableSHARK. A screen
similar to Figure 8.1.2A will appear. The layout of the screen shows a graphic and numeric representation of
the information received by the CableSHARK. The graph’s vertical scale depicts the relative Attenuation
Level or Insertion Loss (in dB) and the horizontal scale depicts frequency (kHz). The distance to the found
valid reflection is shown on the status line.
Note: For the Single-Ended FR test, the CableSHARK can only measure the returned reflection
signals with up to 75 dB of attenuation.
The Cursor Position (kHz) and Attenuation (dB) are numeric representations of the solid cursor line bisecting
the result line of the test. By using the Cursor Pad LEFT/RIGHT arrow keys on the front panel of the
CableSHARK, the user can move the cursor line to different positions along the result line to see the
different values of frequency samples.
MAIN
MENU
E
F
CHG
Single end frequency response test complete. (for 3995 ft)
dB
0.0
20.0
40.0
60.0
80.0
dB
Attenuation = 38.10 dB
Cursor Position = 1263.56 kHz
4
555
1106
2208
1657
SAVE/
UPLOAD
SHOW
REF
TEST
SETUP
0.0
20.0
40.0
60.0
80.0
ZOOM IN
HORIZ
kHz
Press or to move cursor
ZOOM IN
VERT
Figure 8.1.2A - Running a Frequency Response Test
Once the test has been completed, the status bar may indicate that the test was completed and/or to what
distance it was tested to or that no reflection was detected. At the completion of a test, the function button