EXFO CableSHARK P3 VF/DSL Cable Qualifier User Manual
Page 111
CableSHARK P3 User Guide
99
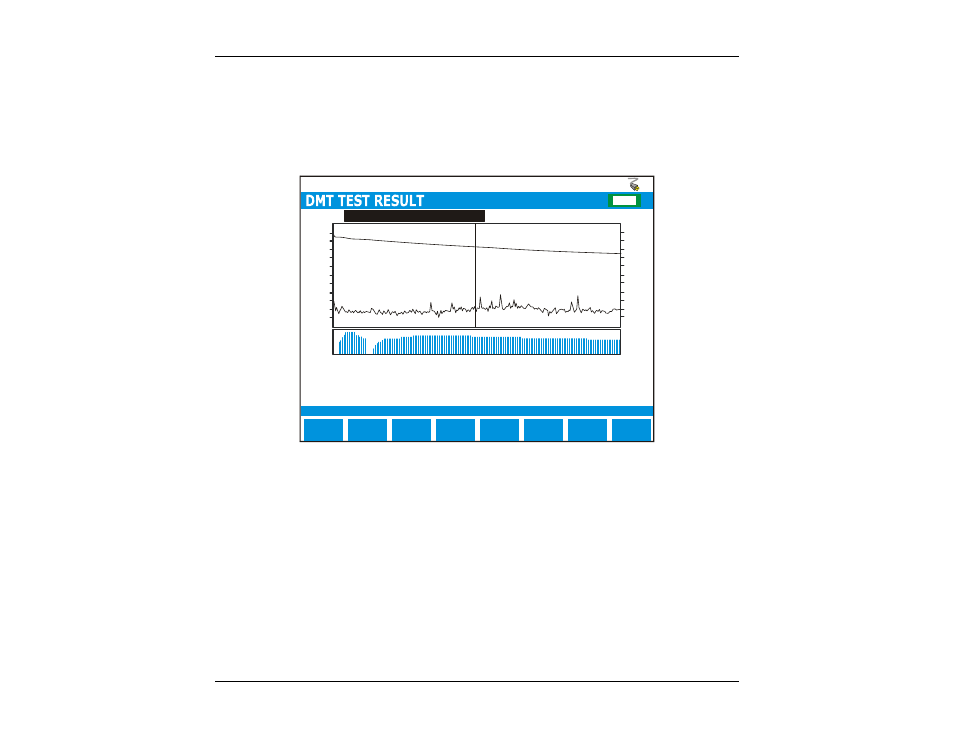
For SINGLE END tests, the CableSHARK will first determine the length of the cable (up to the first major
impairment which could be the end of the cable), then perform a noise test, attenuation test, and determine
the bits/bin for ADSL upstream and downstream parameters.
Figure 8.3.2A shows an example of the results obtained from a DMT Test Measurement with ANSI FULL
RATE/POTS selected under the ADSL Evaluation option.
0
279
554
1104 kHz
829
MAIN
MENU
E
CHG
TEST
SETUP
Single end DMT test complete (for 3971 ft ) CPE
SHOW
REF
Cursor Tone/Freq
Tone Level
Noise Level
S/N Ratio
127 / 547.687 kHz
-53.32 dBm/Hz
-132.28 dBm/Hz
80.4 dB
Number Of Bits
Upstream Rate
Downstream Rate
Noise Margin Up/Down
11
1024 kbps
8192 kbps
6 / 7
-10
-20
-30
-40
-50
-60
-70
-80
-90
-100
-110
-120
-46
-56
-66
-76
-86
-96
-106
-116
-126
-136
-146
-156
dBm/tone
dBm/Hz
=
=
=
=
=
=
=
=
F
SAVE/
UPLOAD
ZOOM IN
HORIZ
EXTRAPOLATED ANSI FULL RATE/POTS RATES
PROBABLE SIGNAL - undetermined
F
IGURE
8.3.2A
-
A
DMT
T
EST
R
ESULT
(ANSI
F
ULL
R
ATE
/P
OTS
S
ELECTED
)
The ADSL FROM CUSTOMER and ADSL FROM CO/EXCH type DMT Tests display three types of
important information. The first is the Tone Level or Signal Power Spectral Density (PSD) in units of
dBm/tone and dBm/Hz, where dBm/tone is the signal energy within the 4kHz bandwidth of DMT tones. It is
the received signal level measured at the input of an ADSL DMT modem respective of the T1.413 and
G.992.2 standards. This can be located at the top of the DMT graph is typically a smooth line.
The second is the noise level or noise PSD in units of dBm/tone and dBm/Hz, where dBm/tone is the noise
energy within the 4kHz bandwidth. The relation between the two units is x dBm/Hz = (x + 36) dBm/tone. This
graph is normally not smooth; typically comprised of many peaks and valleys.
The third and greatest feature is the lower ‘bit/bin’ or 'bit/tone' graph, which indicates the maximum bits that
can be allocated to an individual DMT tone according to the measured tone level and noise level at that tone
frequency. This graph shows an easy to understand representation of the effects of signal attenuation and