EXFO CableSHARK P3 VF/DSL Cable Qualifier User Manual
Page 162
VF / DSL Cable Qualifier
150
F
IGURE
8.10.2A
-
R
UNNING A
L
OOP
M
APPER
T
EST
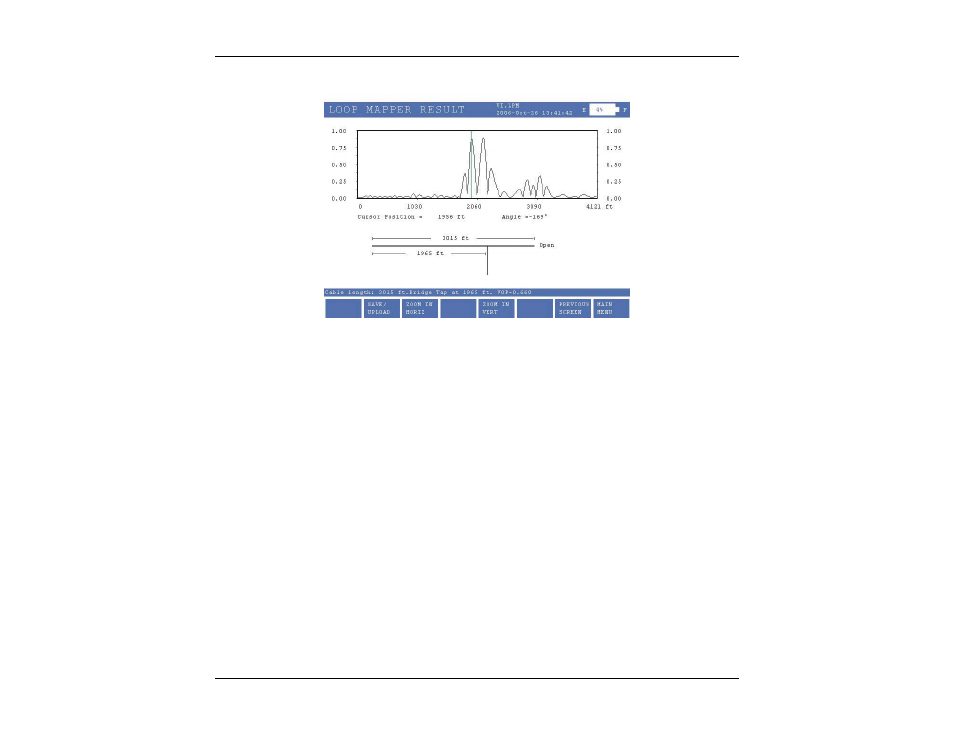
The layout of the screen shows a graphic and numeric representation of the information received by the
CableSHARK. The graphs’ vertical scale depicts a relative scale where 0 to +1 indicates that a discontinuity
was found whose impedance differs from the characteristic impedance of the tested cable. The horizontal
scale shows the location of the fault or end of cable in either feet or meters.
The numeric results are listed under the graph and they are very easy to understand. If the CableSHARK
has successfully found any reflections, it will place the cursor onto the first reflection and adjust the Graph
Scale automatically if necessary so that the first reflection is within the display screen.
The information about reflections that are found is shown on the screen, including a graphical representation
of the cable topology, where the length of each segment of the bridge tap (if present) is shown in feet, or
meters as selected.
The cursor position, representing the location on the loop is clearly indicated, as well as the angle or phase
for the reflected signal at this point. This angle will determine the type of fault located at a specific point of
the loop. The LoopMapper technique is able to identify a reflection caused by an Open Circuit because of its
0
° angle reflection, similarly, the origin of a Bridge Tap or Short Circuit produces a 180° reflection. The
following table summarizes the cable condition versus the angle of the reflection it produces.