Displaying the event log – Allied Telesis AT-S62 User Manual
Page 124
Chapter 11: Event Log and Syslog Servers
124
Section II: Advanced Operations
Displaying the
Event Log
To view the event log, do the following:
1. From the Home Page, click either Configuration or Monitoring.
2. Select the System menu option.
3. Select the Event Log tab.
The Event Log tab is shown in Figure 29 on page 123.
4. Configure the following options:
Severity Selections
Displays events of a selected severity. Event severity is a predefined
value assigned to an event according to its potential impact on switch
operation. There are four severity levels, as defined in Table 2. The
default is informational, error, and warning. You can specify more than
one severity (for example, E,W).
Display Order
Controls the order of the events in the log. Choices are Chronological,
which displays the events in the order oldest to newest, and Reverse
Chronological, which displays the events newest to oldest. The default
is Chronological.
Mode
Controls the format of the event log. Choices are Normal, which
displays the time, module, severity, and description for each event,
and Full, which displays the same information as Normal, plus
filename, line number, and event ID. The default is Normal.
Module Selections
Displays events of a selected AT-S62 module. The AT-S62
management software consists of a number of modules, each
responsible for a different part of switch operation. You can instruct the
switch to display only those events that apply to selected modules.
The default is ALL, which displays the events for all modules. You can
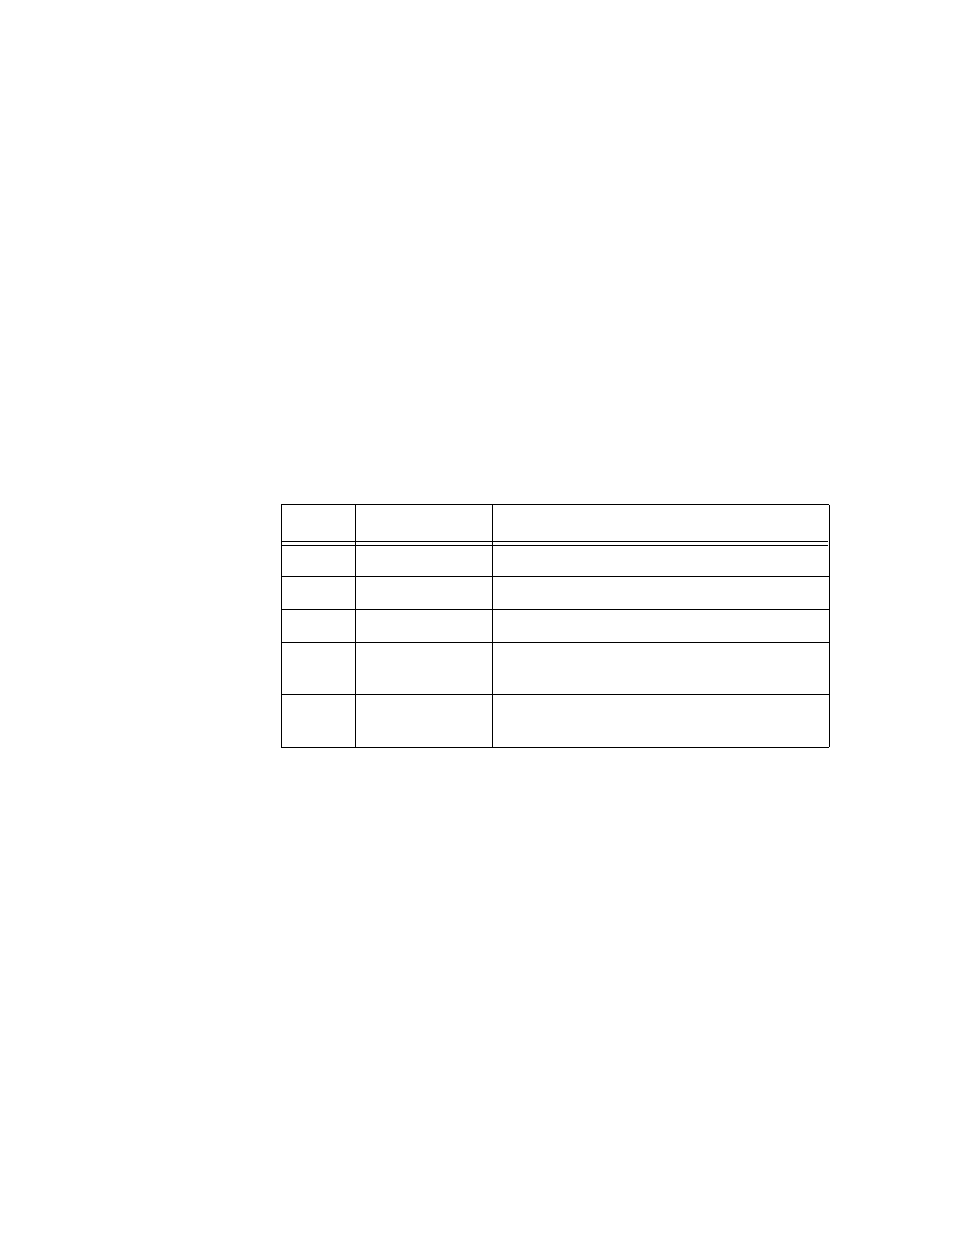
Table 2. Event Log Severity Levels
Value
Severity Level
Description
ALL
-
Selects all severity levels
E
Error
Switch operation is severely impaired.
W
Warning
An issue may require manager attention.
I
Information
Useful information that can be ignored
during normal operation.
D
Debug
Messages intended for Technical Support
and Software Development.