Analyzer plug-in – Lab.gruppen PLM 20K44 User Manual
Page 217
212
Lake Controller Operation Manual Rev 1.5.4
Analyzer Plug-in
18.4.4.5 Amplitude Range
▸
Move Primary Up: Moves displayed range upward to show higher magnitudes.
▸
Move Primary Down: Moves displayed range downward to show lower magnitudes.
▸
Zoom Primary In: Magnifies the displayed vertical range for most plot types or narrows the magnitude
range of the Spectrograph display.
▸
Zoom Primary Out: Decreases magnification of the vertical range of the primary display for most plot
types or widens the magnitude range of the Spectrograph display.
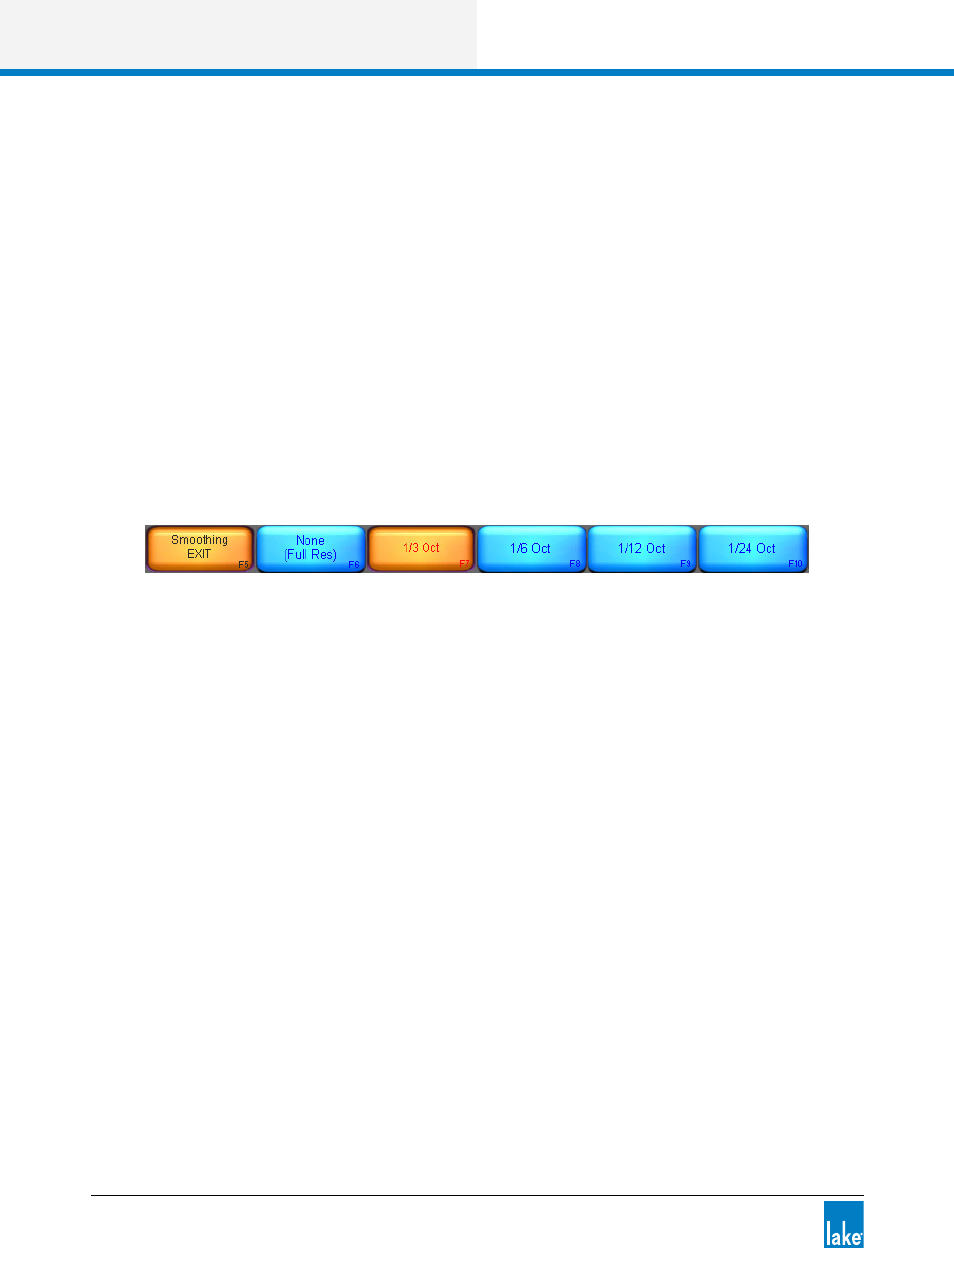
18.4.4.6 Smoothing
Smoothing is a graphical averaging available only in Transfer Function mode. This feature helps reduce
jagged display on the Transfer Function trace helping to more clearly visualize the overall system response.
Figure 18-15: Smoothing submenu
18.4.4.7 Coherence
Selecting the Coherence button will turn on the Coherence trace display. The Coherence is displayed in red
in the top-half of the screen. The Coherence y‐axis scale is displayed in red on the right side of the display.
Coherence is a measure of quality (such as signal to noise ratio and time-matching) between signals in a
transfer function measurement. Coherence values are given as a percentage, where 100% equals perfect
coherence; values closer to one equal improved quality and therefore more accurate results. It is important
to note that low coherence values do not necessarily mean your data is untrustworthy. This is particularly
true when making acoustic measurements in environments with many reflections where a lot of averaging
is required.