ADS Environmental Services Profile Software 950015B6 User Manual
Page 587
18-26 Profile Software User's Guide
CONFIDENTIAL – Covered by ADS Software License Agreement
1998 - 2012 ADS LLC. All Rights Reserved.
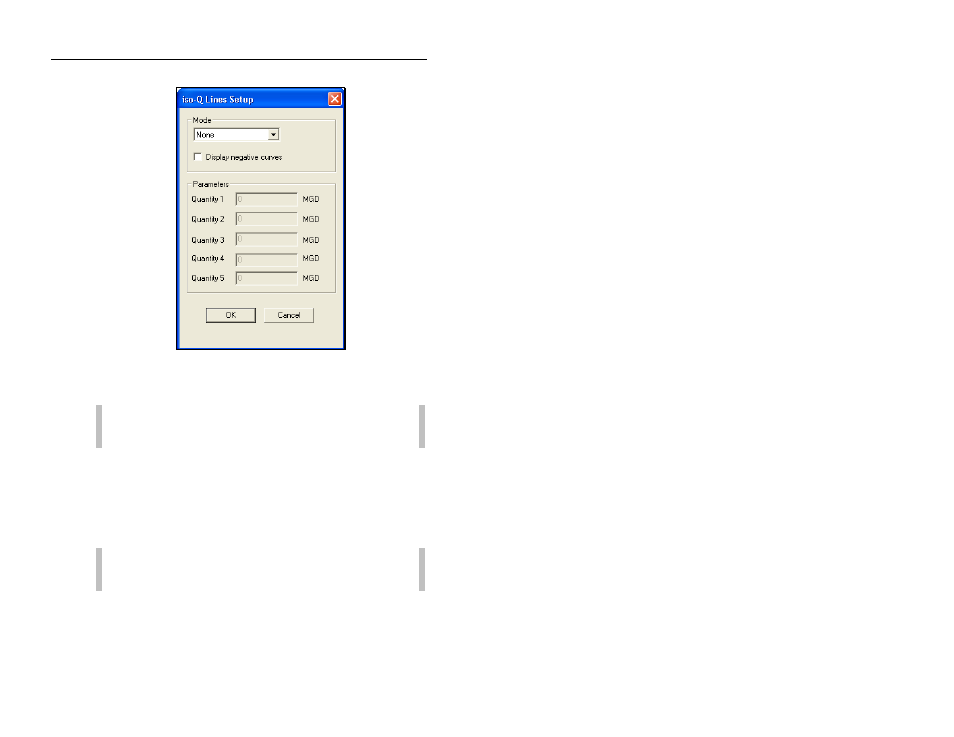
Iso-Q Lines Setup window
2. Select Specified from the Mode drop-down list to enable the
Parameters section.
Note: To remove iso-Q lines from the scattergraph, select
None from the Mode drop-down list.
3. Enter the quantity values you wanted graphed as lines in the
Quantity fields. Display up to five iso-Q lines. Entering a 0 in
a Quantity field results in no line displayed.
4. Select the Display negative curves checkbox when you have
negative flow (velocity, for example) data. Profile displays the
negative data plotted with the negative iso-Q lines.
Note: Save the scattergraph report as a template and all
configured iso-Q lines will save in the template.
5. Select OK to close and save the information.
Profile displays the iso-Q lines on the scattergraph.