Displaying questionable data, Displaying the data quality – ADS Environmental Services Profile Software 950015B6 User Manual
Page 402
Hydrograph Editor
10-11
CONFIDENTIAL – Covered by ADS Software License Agreement
1998 - 2012 ADS LLC. All Rights Reserved.
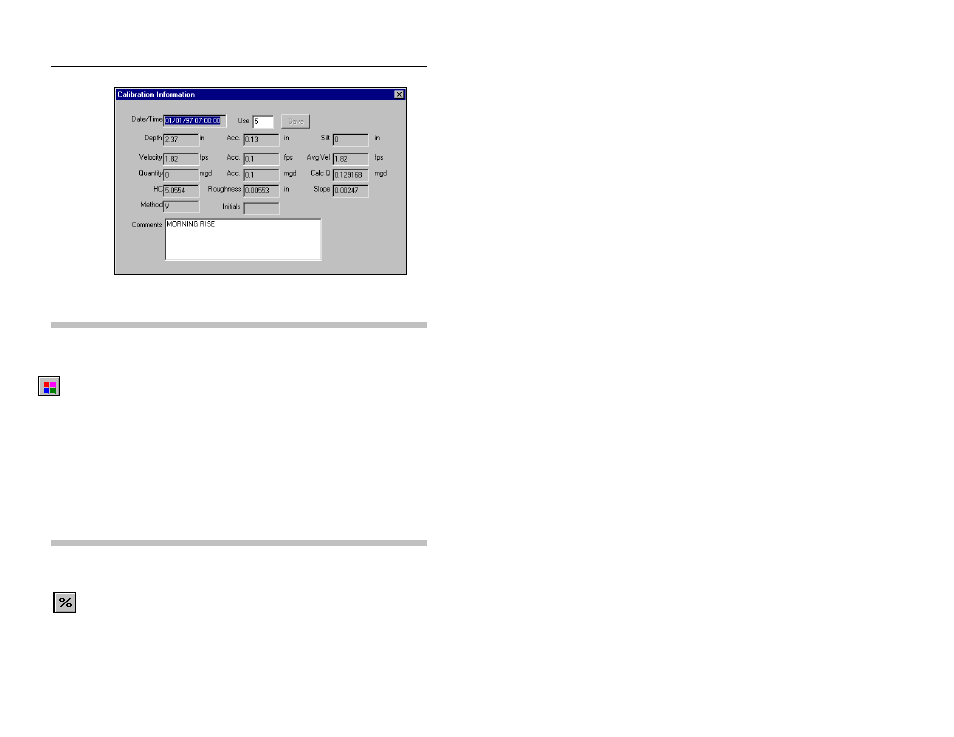
Viewing confirmation information
Displaying Questionable Data
Questionable
Data
button
Use the Questionable Data toolbar button to display or hide
hydrograph data that has questionable quality (questionable data
displays in blue). Questionable Data is first identified by
establishing a tolerance range using the Scattergraph Editor tool.
Any data falling outside the scattergraph tolerance range is defined
as having questionable quality. Refer to the Scattergraph Editor,
Chapter 12, for more information on establishing tolerances.
Depress the Questionable Data toolbar button to display the
questionable data or de-select the button to hide the questionable
data.
Displaying the Data Quality
Quality
Range
button
Use the Quality Range toolbar button to display data quality
information on the hydrograph. As the monitor generates data, it
assigns each data point a quality statistic between 0 and 100%.