Graphical and tabular balance reports, Graphical balance reports – ADS Environmental Services Profile Software 950015B6 User Manual
Page 520
15-12 Profile Software User's Guide
CONFIDENTIAL – Covered by ADS Software License Agreement
1998 - 2012 ADS LLC. All Rights Reserved.
Graphical and Tabular Balance
Reports
Refer to the following sections for reference information on
graphical and tabular balance reports.
Graphical Balance Reports
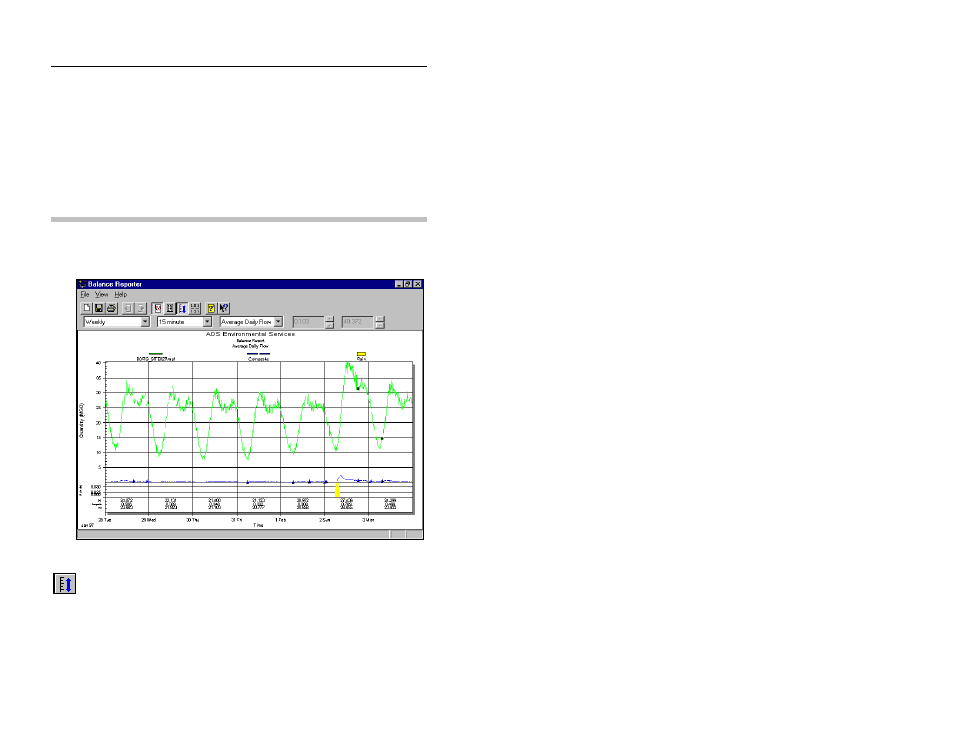
Following is a sample graphical balance report:
Sample graphical balance report
Autoscale
button
The graph's flow scales are based on the highest and lowest flow
values during the period. Select the Autoscale toolbar button to
automatically set the flow scales. Manually set the flow scales by
de-selecting the Autoscale toolbar button and entering new values
into the Minimum Y and Maximum Y fields.