Metrohm 840 PC Control 5.0 / Touch Control User Manual
Page 65
3
Operation
PC Control / Touch Control
53
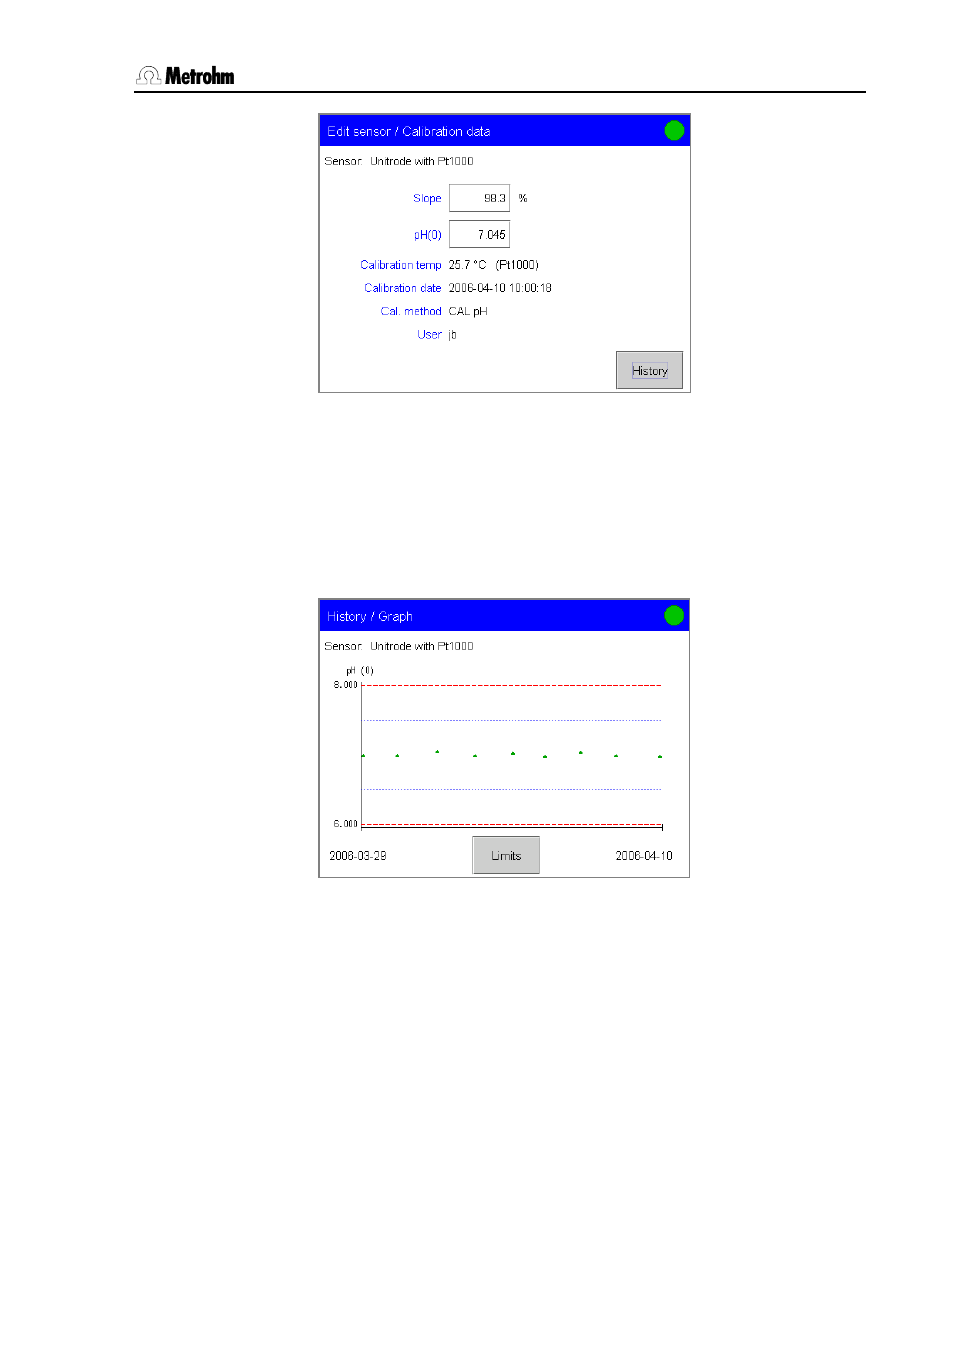
Under Calibration data/History the calibration data, dates and
times of the last ten calibrations are shown in the form of a table.
Calibration data which have been determined automatically is shown in
green, manually entered calibration data is shown in black and marked
with (m). With [Graph slope] and [Graph pH(0)], or [Graph E(0)]
you can open a graph in which the slope or pH(0) for pH electrodes or
E(0) for ISE electrodes is plotted against the calibration date. If a sensor
has to be replaced then you can delete the complete history with
[Delete history].
This graph corresponds to a control chart on which both warning
limits and intervention limits are shown for the calibration data. The
values for these warning limits and intervention limits can be entered
under Graph/Limits. No automatic action is taken when these limits
are infringed.
3.9.5 Monitoring the calibration interval (for pH and ISE electrodes
only)
You can monitor the time interval after which the sensor must be
recalibrated. (A detailed description of the monitoring function using
"Titer validity" as an example can be found in Section 3.8.4.) For
documentation purposes you can enter the starting date without
monitoring the time interval.