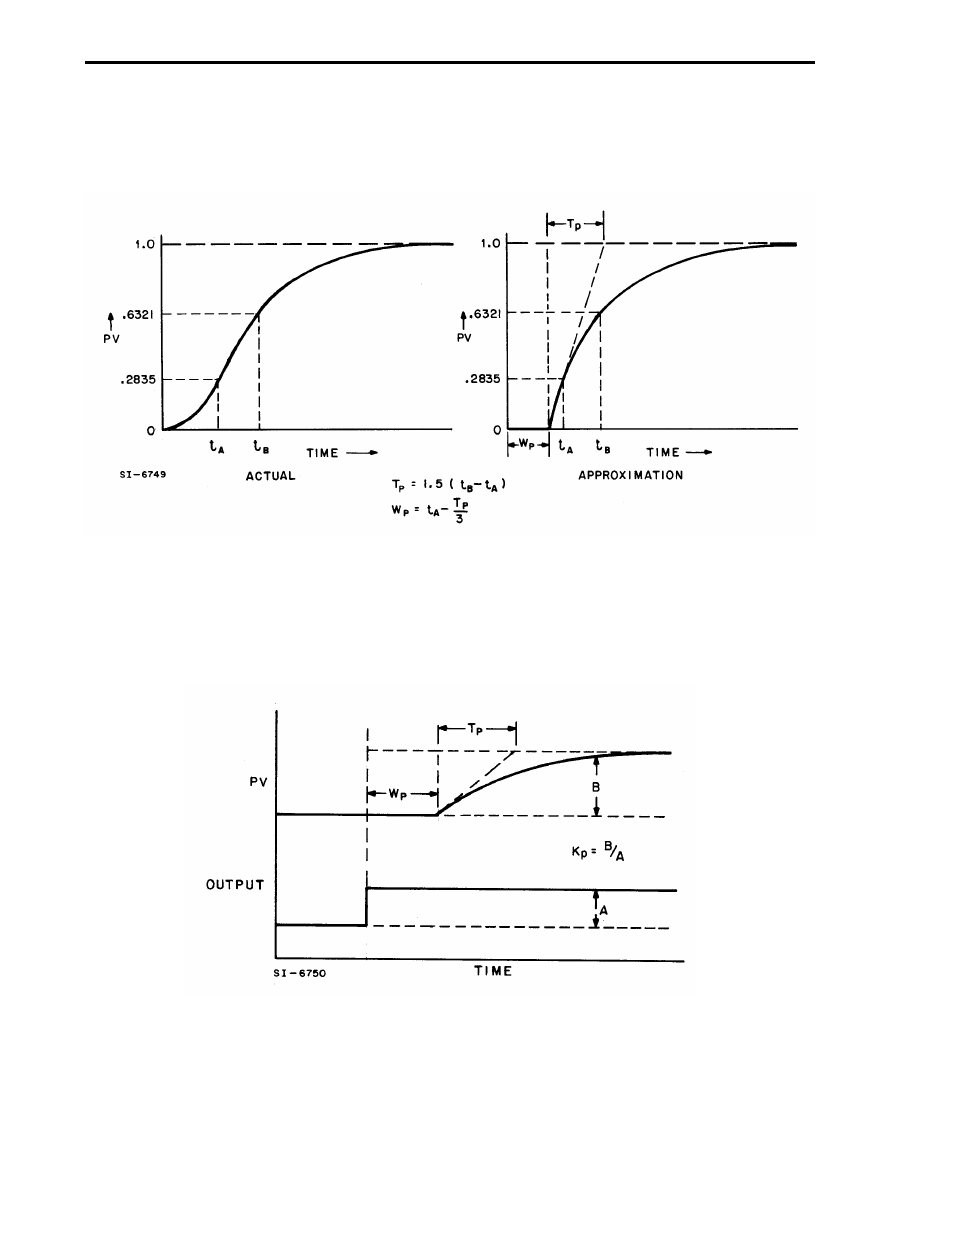
Figure 17-2. process step response curve – Micromod Micro-DCI: 53MC5000 Multi-Loop Process Controller Instruction Manual User Manual
Page 307
See also other documents in the category Micromod Equipment:
- Micro-DCI: EP1000A E-Port (56 pages)
- Micro-DCI: 53SL6000 Single Loop Controller (138 pages)
- Micro-DCI: 53SL5100B Single Loop Controller (115 pages)
- Micro-DCI: 53ML5100 Manual Loader (49 pages)
- Micro-DCI: 53MC5000 PLC AND PRINTER INTERFACES (124 pages)
- Micro-DCI: 53MC5000 MicroLink (33 pages)
- Micro-DCI: 53MC5000 Multi-Loop Process Controller Installation (99 pages)
- Micro-DCI: 53MC5000 Multi-Loop Process Controller FLEXIBLE CONTROL STRATEGIES (201 pages)
- Micro-DCI: 53MC5000 Multi-Loop Process Controller CUSTOMIZATION GUIDE (123 pages)
- Micro-DCI: 53IT5100B Micro-DCI 4-Channel Indicator Totalizer (71 pages)
- Micro-DCI: 53MC5000 Training Manual (180 pages)
- Micro-DCI: 53SL5100A Single Loop Controller Rev. 1 Firmware (6 pages)
- Micro-DCI: 53SL5100A Single Loop Controller (152 pages)
- Micro-DCI: 53ML5100A LOADING STATION REV. 1 FIRMWARE (20 pages)
- Micro-DCI: 53ML5100A LOADING STATION (55 pages)
- Micro-DCI: 53IT5100A Indicator/Totalizer Rev. 1 Firmware (4 pages)
- Micro-DCI: 53IT5100A Indicator/Totalizer (80 pages)
- MOD: 2001P - MODCELL Logic Control Identity Module (Version 6) System, I/O and Communications Functions (272 pages)
- MOD: 2001P - MODCELL Logic Control Identity Module (Version 6) Algorithms, Tables and Sequential Logic Functions (160 pages)
- MOD: 2004P - MODCELL Continuous Control Identity Module (Version 3) PID and Ramp/Soak Functions (70 pages)
- MOD: 30ML and Modcell Totalization Application Guide (24 pages)
- MOD: 30ML and Modcell Maintenance for 2001N, 2002N, and 1800R (152 pages)
- MOD: Remote I/O Modules for use with 2020N Remote I/O Interface Module (42 pages)
- MOD: MODCELL Multiloop Processor 2002N Model C and Associated Hardware (82 pages)
- MOD: 30ML Installation (106 pages)
- MOD: 30ML Replacement for MOD30 Instruments (36 pages)
- MOD: 30ML Installation for Replacing SLC/CLC Instruments (68 pages)
- MOD: 30ML Function Code Configuration Guide for Replacing SLC/CLC Instruments (394 pages)
- MOD: 30ML Operation and Template Setup (84 pages)
- MOD: 30ML Functions Data Base Reference (152 pages)
- MOD: 30ML Display Script Guide (98 pages)
- MOD: 30ML FrontFace Configuration Charts (6 pages)
- MOD: 30ML Quick Reference Guide (2 pages)
- MOD: 30ML Controller Operation and Maintenance Training Manual (74 pages)
- MOD: Modcell 2050R Users Guide (228 pages)
- MOD: Modcell 2050R MODBUS Communications (70 pages)
- MOD: Modcell 2050R Quick Reference Guide (2 pages)
- MOD: Modcell 2050R Mounting Dimensions (1 page)
- MOD: Modcell 2050R 2050FZ0, QS-1300/1400 to 2050R Conversion Accessory (10 pages)
- MOD: Modcell 2050R 2051FZ2, Foxboro 62H to 2050R Conversion Accessory (4 pages)
- MOD: Modcell 2050R 2051FZ1 and 2051FZ1, Foxboro SPEC 200 to 2050R Conversion Accessory (4 pages)
- MOD: 1731N ICN Mini-Link Users Guide (28 pages)
- MOD: 1732N, 1733N External Mini-Link Users Guide (22 pages)
- MOD: ICN OPC Server Users Guide (38 pages)