3 displaying multiple graphs – Teledyne LeCroy USB Protocol Suite User Manual (Voyager_Advisor T3_Mercury) User Manual
Page 256
Teledyne LeCroy Corporation
Real Time Monitoring
256
USB Protocol Suite User Manual
area.
Y Scale Type:
Linear: Converts display to linear format.
Logarithmic: Converts display to logarithmic format.
Hide: Hides the selected graph.
Remove: Removes the selected graph.
Properties: Opens a dialog box with options for changing the colors, titles and
other features of the graphs.
9.14.3
Displaying Multiple Graphs
The Real Time Statistics window gives you the ability to create up to three separate
graphing windows so that you can create separate graphs of traffic and tile them
vertically. Within these windows, you can format the graphs in a number of ways.
To view two or three graphs simultaneously,
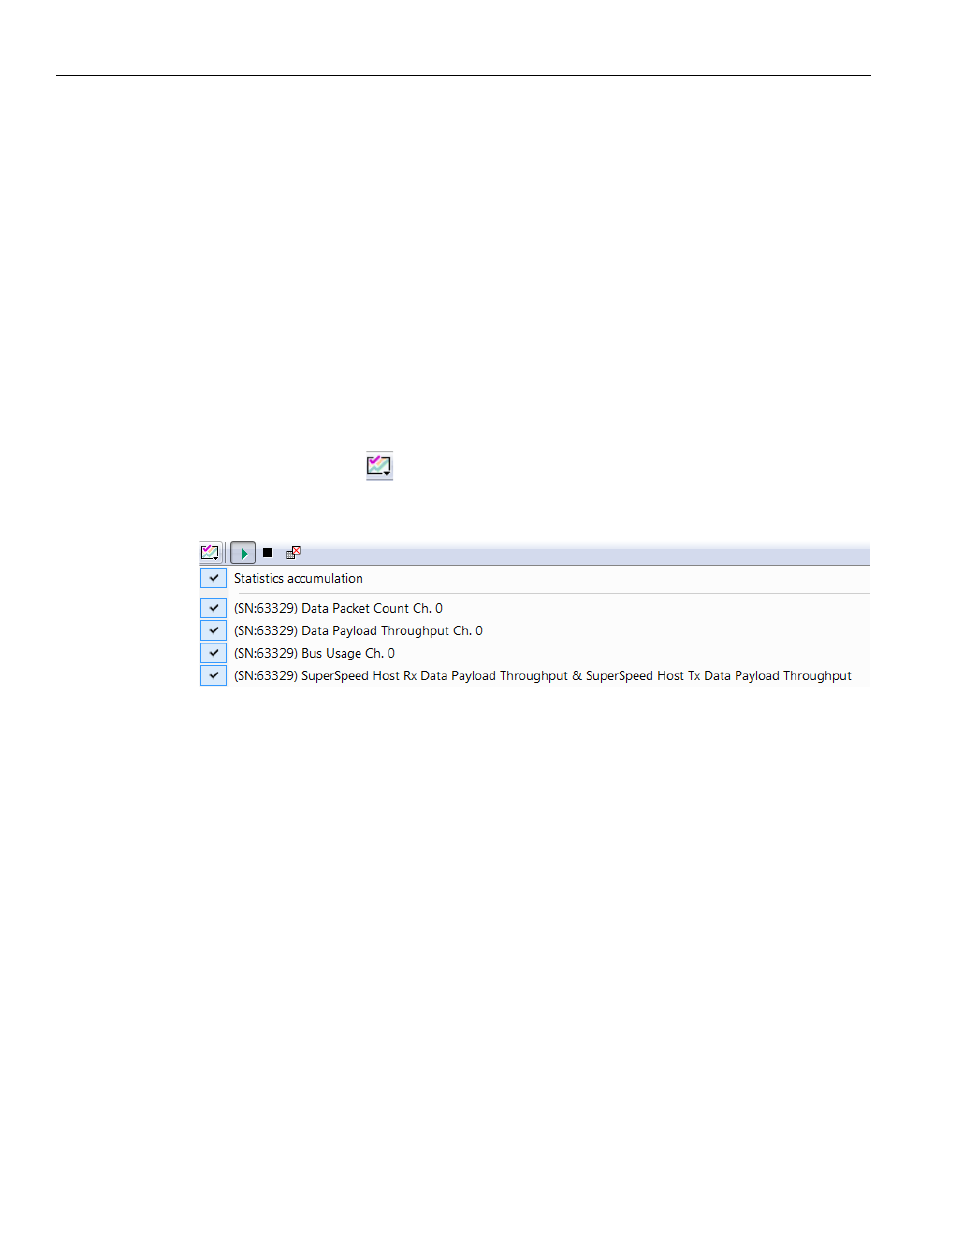
click the Graph Areas
button.
The following menu opens.
Figure 9.42: Graph Areas Menu Options
Selecting a checkbox displays the selected graph type:
Statistics Accumulation: Plots the percentage of Link utilization by non‐idle traf‐
fic for both directions of the link.
Data Packet Count (Packets/s): Plots counts of Data Packets per second for both
directions of the link.
Data Payload Throughput (MBytes): Plots data payload throughput for both
directions of the link.
Bus Usage: Plots amount of Bus usage.
SuperSpeed Host Rx Data Payload & SuperSpeed Host Tx Data Payload: For USB
3.0, the Real‐Time Statistics window can display a SuperSpeed graph of real‐time
link activity.