1 real-time statistics buttons – Teledyne LeCroy USB Protocol Suite User Manual (Voyager_Advisor T3_Mercury) User Manual
Page 254
Teledyne LeCroy Corporation
Real Time Monitoring
254
USB Protocol Suite User Manual
For USB 3.0, the Real‐Time Statistics window can display a SuperSpeed graph of real‐time
link activity.
The Link Statistics are displayed on the right bottom panel in the previous screen capture.
They are defined as:
RD: Running Disparity Errors
Inv Sym: Invalid 10‐Bit Symbol
In order to see a graph of traffic, you must start recording.
Press
to start the Real‐Time statistics monitor. As traffic is recorded, data is streamed
in real time to this window and presented in a format of your choice.
To stop the monitor, press
.
9.14.1
Real-Time Statistics Buttons
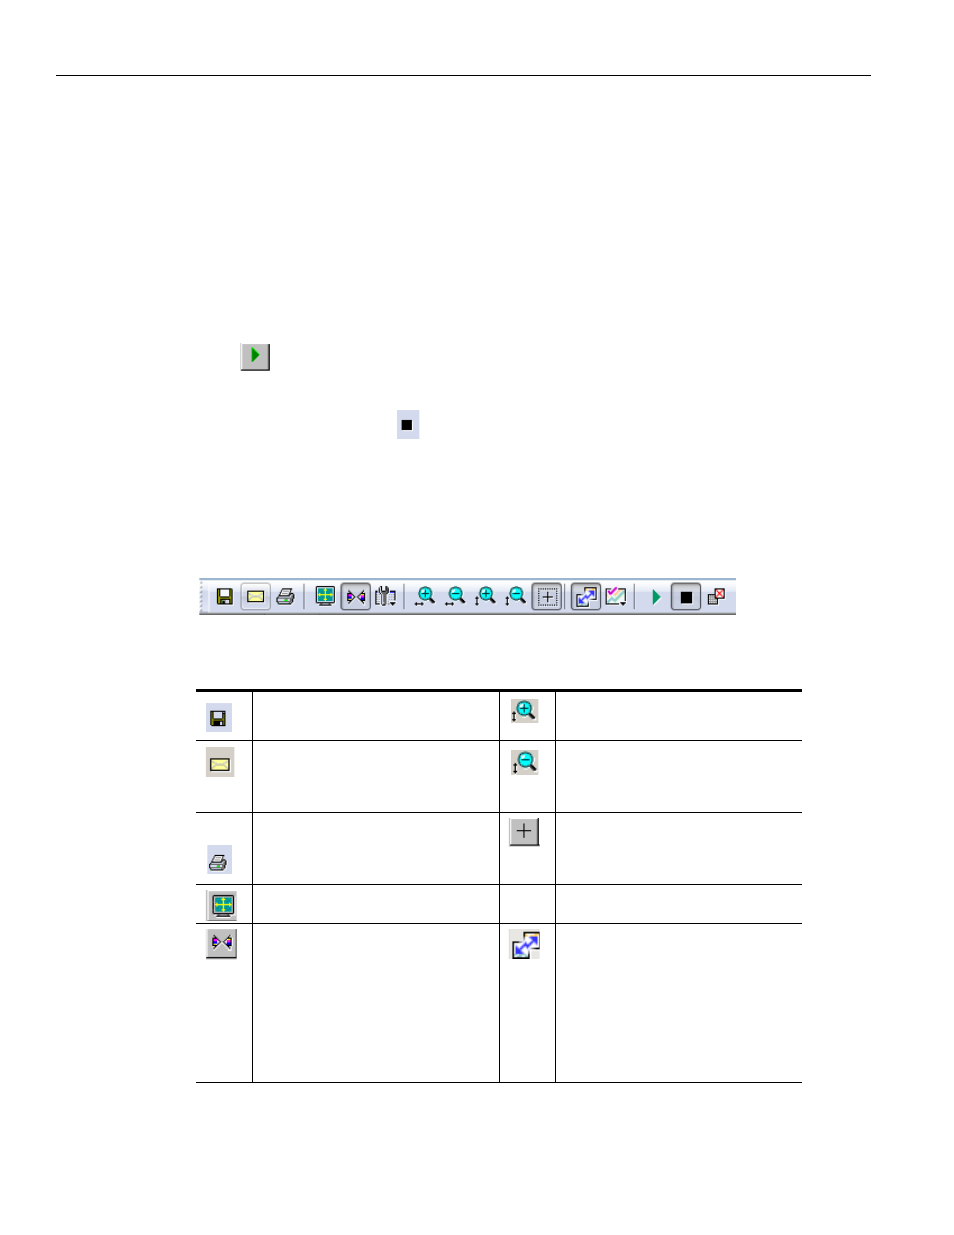
The Real‐Time Statistics toolbar has buttons for changing the format of the displayed data
and for exporting data:
Figure 9.40: Real time Statistics Buttons
The buttons have the following functions:
Save As ‐ Saves Real‐Time
graphs as bitmap files (*.bmp)
Vertical zoom in
Email ‐ Creates an email with
a *.bmp file attachment of
the graphs
Vertical zoom out
Click and Drag zoom ‐ Click
diagonally to select and zoom
in on part of the graph
Full Screen
Synchronize with other Views.
Synchronizes the View
windows so that a move in
one window repositions the
other. See
Sync and Graph areas ‐ If two
or more graphs are displayed,
this button synchronizes the
graphs to one another. Once
synchronized, the positioning
slider of one graph moves the
other graphs.