2 real-time statistical monitor pop-up menu – Teledyne LeCroy USB Protocol Suite User Manual (Voyager_Advisor T3_Mercury) User Manual
Page 255
USB Protocol Suite User Manual
255
Real Time Monitoring
Teledyne LeCroy Corporation
To clear the counters in the “Statistics Accumulation” area,
click the Restart
button.
To save a snapshot Microsoft Excel .csv file of the data before clearing the values,
click the Save and Restart
button.
The file is in the same folder where Trace files are saved.
The naming convention of the file is:
RTS_Capture_YYYY‐MM‐DD_HH‐MM‐SS.csv
Note:
Because file writing must happen immediately, there is no file naming dialog.
Note:
If you click the button more than once a second, the previous file with the same timestamp will
be lost.
9.14.2
Real-Time Statistical Monitor Pop-up Menu
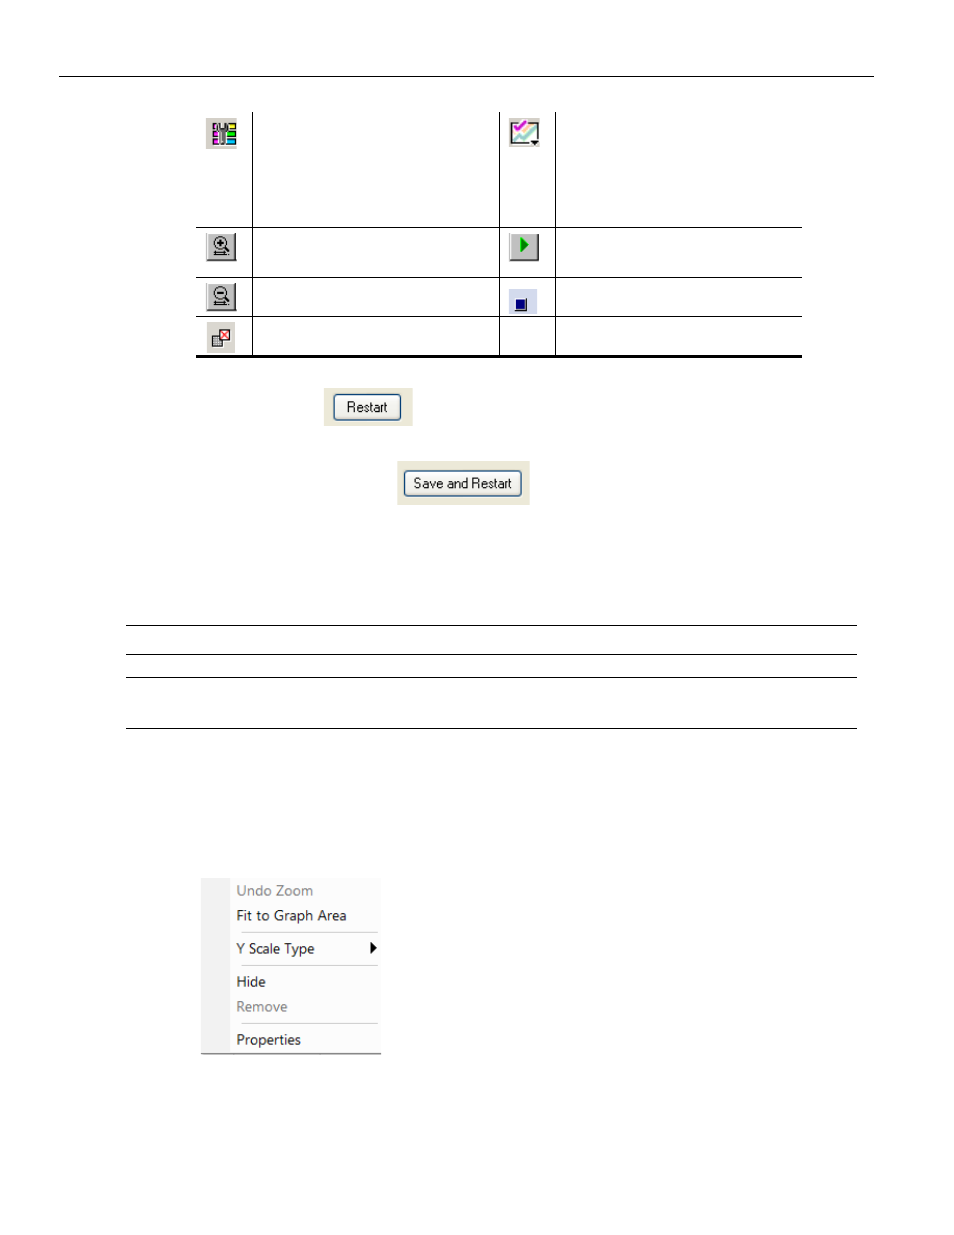
If you right‐click a graph in the Real‐Time window, a pop‐up menu appears with options
for changing the format of the display:
Figure 9.41: Real-Time Statistical Monitor Pop-up Menu
Undo Zoom: If you have zoomed in, undoes the zoom.
Fit to Graph Area: Displays graph so that the entire trace fits inside the graph
View Settings ‐ opens a sub‐
menu with options for
formatting the display. See
Graph Areas ‐ Presents
options for displaying
additional graphs of data
lengths, packet lengths, and
percentage of bus utilized.
Horizontal zoom in
Start. Starts the Real‐Time
Monitor.
Horizontal zoom out
Stop Real‐Time Monitoring.
Reset graphs.