3 resource chart, Resource chart – Clear-Com HX System Frames User Manual
Page 277

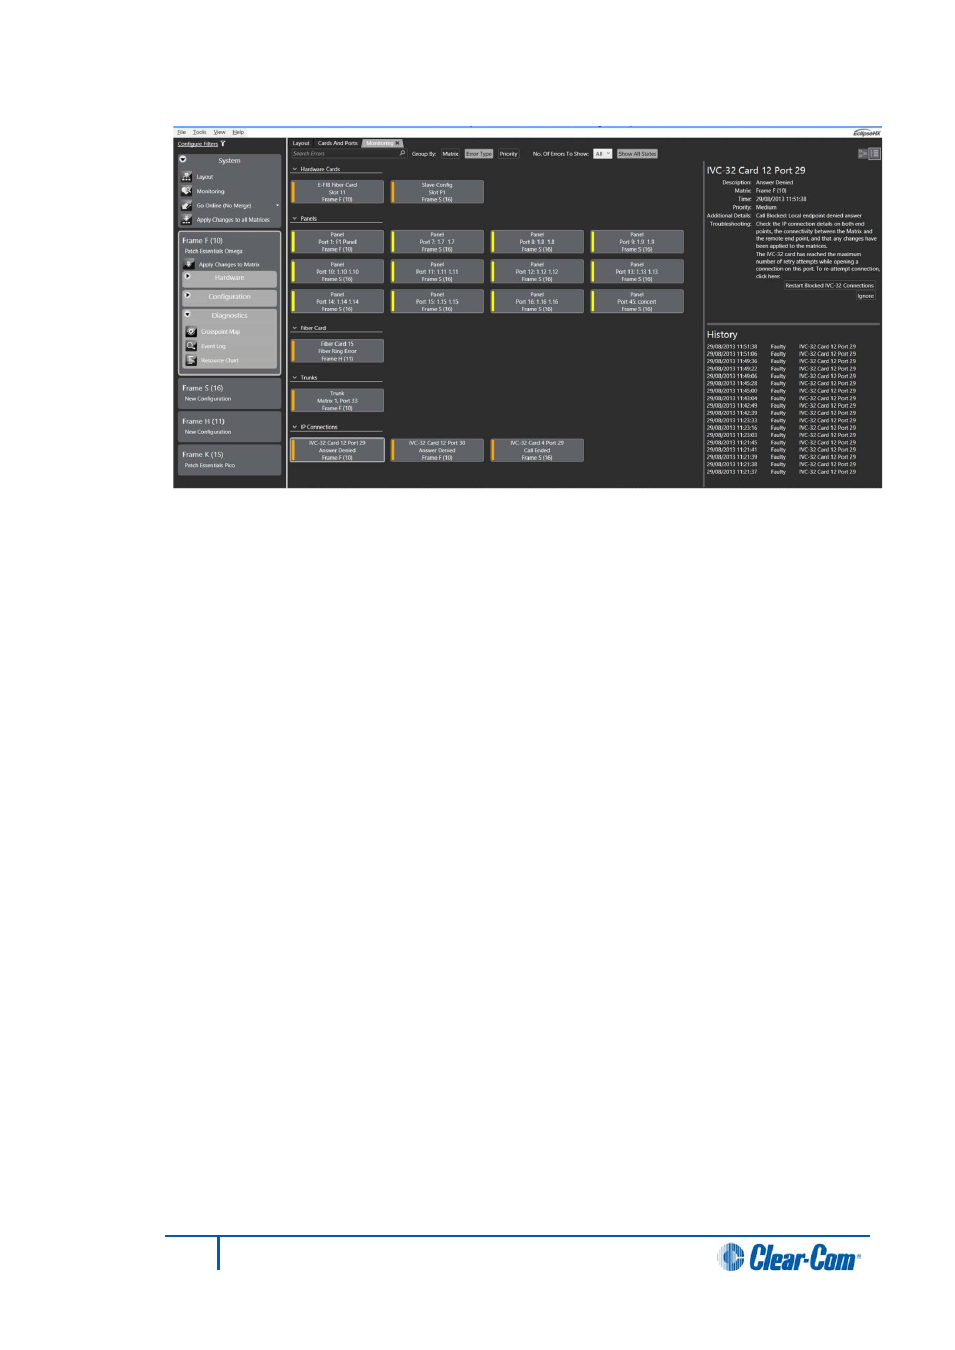
Figure 13-15 Detailed system monitoring view
If an error is selected, the right-hand side of the monitoring screen shows detailed
information about that particular error, including any additional details that might
be available and a short troubleshooting guide. A history of the state of that
particular error is also shown, so you can see when this fault happened and
whether it has happened previously.
3)
You can ignore errors by right clicking on them in the error list (in either overview
or detailed view) and selecting Ignore from the context menu. There is also an
Ignore button shown in the details for each error.
13.3
Resource chart
The Resource Chart allows you to view the system resources that would be used by your
current configuration if it were to be downloaded to the matrices.
When you build the current configuration for the Resource Chart, the system resources are
displayed as a percentage of the maximum permitted value.
Color coding indicates the different usage levels:
•
Green
= Low usage.
• Amber = Medium usage.
• Red = High usage.
277
Eclipse EHX Software User Guide
