Section 4.7.3.4 f, Figure 4-4 sho – HP StorageWorks Scalable File Share User Manual
Page 81
Viewing performance statistics
4–25
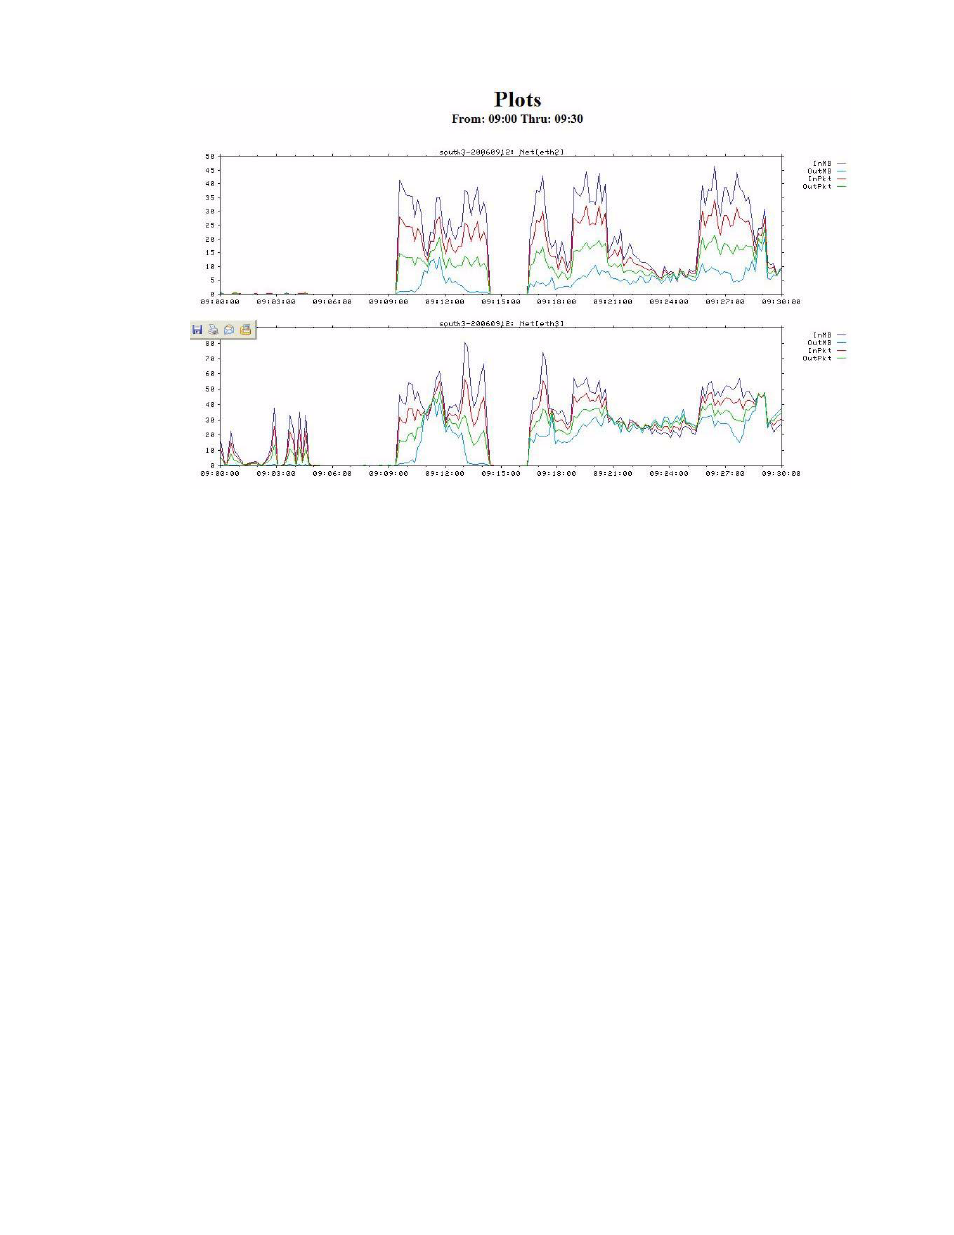
Figure 4-4
A detailed graph showing throughput to OST devices from specified network devices
4.7.3.4
Viewing RPC transfer sizes or disk I/O transaction sizes
There are four configuration files that provide information about remote procedure call (RPC) transfer sizes
and disk I/O transaction sizes. The files are:
•
ost-brw.cfg
—Provides cumulative RPC statistics, including the number of pages of data in each
RPC sent or received on the server, for all OST devices served by the server.
•
ost-brwD.cfg
—Provides RPC statistics similar to those provided in the
ost-brw.cfg
file, but for
each individual device.
•
ost-blk.cfg
—Provides cumulative disk I/O transaction size statistics, including the size of each
I/O block written to or read from disk on the server, for all OST devices served by the server.
•
ost-blkD.cfg
—Provides disk I/O transaction size statistics similar to those provided in the
ost-blk.cfg
file, but for each individual device.
To view disk I/O transaction sizes or RPC transfer sizes, perform the following steps on the ColPlot page. In
this example, the data in the
ost-blk.cfg
file is plotted:
1.
Enter the dates and times for which the graph is to be plotted (areas 1 and 2 in Figure 4-1).
2.
In the text field that allows you to specify the server name (area 3 in Figure 4-1), enter the name of the
server; for example,
south3
.
3.
In the Detail Filters text box (area 6 in Figure 4-1), type in the name of the device for which you want
the graph to be plotted. For example, to view information for device
/dev/cciss/c3d1
, type in
c3d1
.
4.
In the Plots by CFG File(s) text field (area 7 in Figure 4-1), type in the name of the file you want to be
plotted, for example,
ost-blk.cfg
.
5.
Click the Generate Plot button.
Figure 4-5 shows an extract from an example of the graph that will be generated. The key on each section
of the graph shows whether the section relates to a read or write bucket, and the bucket size.