HP StorageWorks Scalable File Share User Manual
Page 78

Viewing system information
4–22
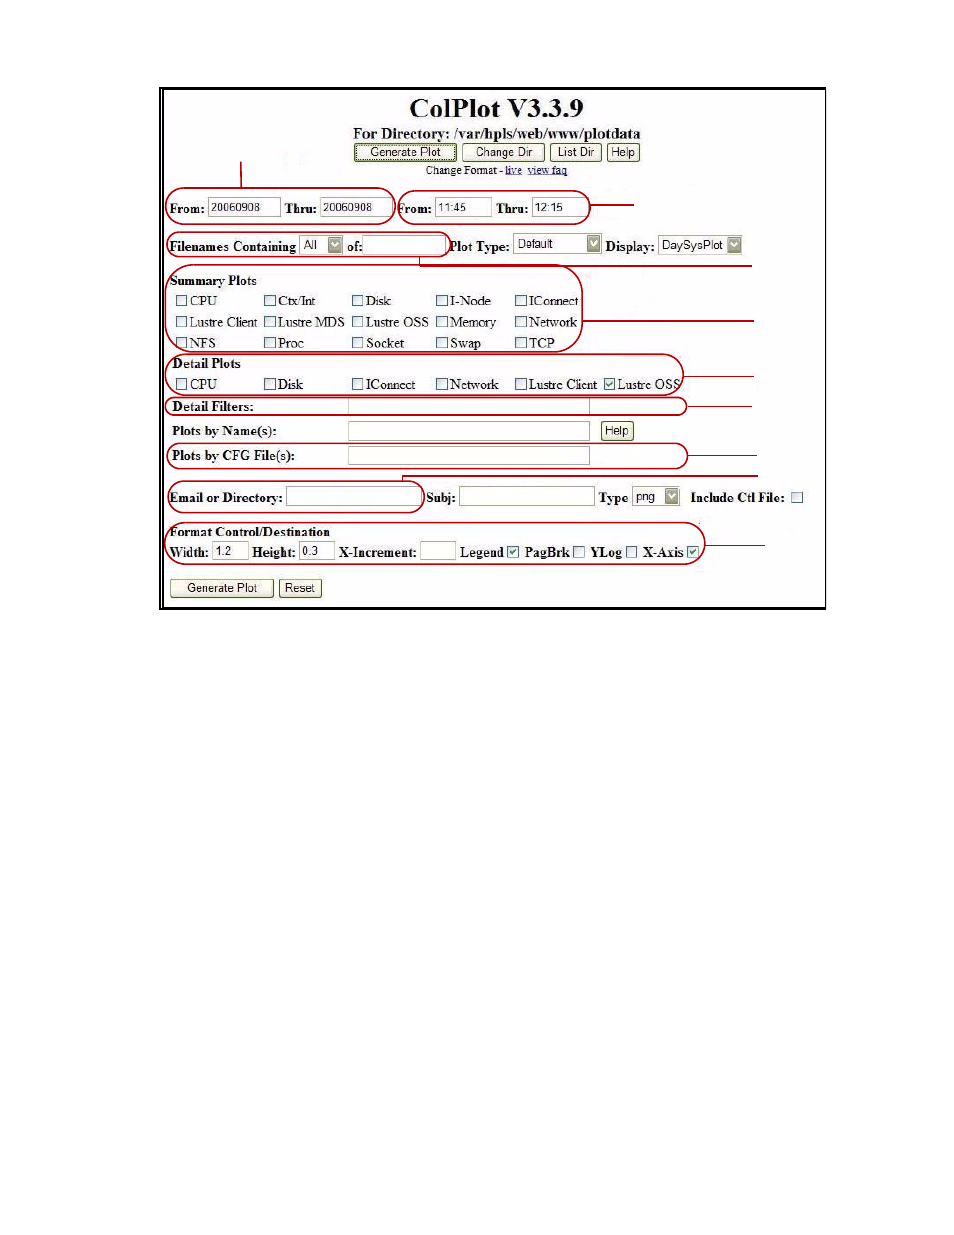
Figure 4-1
The ColPlot Web page
The highlighted areas of the Web page shown in Figure 4-1 are as follows:
1.
Dates for which graph is to be plotted (start date and end date). Enter the date in the format
YYYYMMDD
.
2.
Time period for which graph is to be plotted (start time and end time). Enter the time in the format
HH:MM
.
3.
Text field that allows you to type in the name of the server for which the graph is to be plotted.
4.
The types of summary graphs that can be plotted.
5.
The types of detailed graphs that can be plotted.
6.
Text field that allows you to type in the name of the element for which detailed graphs are to be
plotted.
7.
Text field that allows you to specify the plot type; see Section 4.7.3.4 for more information.
8.
Text field that allows you to specify an email address to which the graphs are to be sent.
9.
Graph attribute fields that allow you to control the size of the graph and other configurable graph
elements.
The following sections provide instruction for using the Web server to view specific information, including
the following tasks:
•
Viewing overall throughput to OST devices from a server (Section 4.7.3.1)
•
Viewing throughput to each OST device from a server (Section 4.7.3.2)
•
Viewing throughput to OST devices from network devices on a server (Section 4.7.3.3)
•
Viewing RPC transfer sizes or disk I/O transaction sizes (Section 4.7.3.4)
1.
2.
3.
4.
5.
6.
7.
9.
8.
