HP StorageWorks Scalable File Share User Manual
Page 79
Viewing performance statistics
4–23
4.7.3.1
Viewing overall throughput to OST devices from a server
To view the overall throughput to OST devices from a server, perform the following steps on the ColPlot page:
1.
Enter the dates and times for which the graph is to be plotted (areas 1 and 2 in Figure 4-1).
2.
In the text field that allows you to specify the server name (area 3 in Figure 4-1), enter the name of the
server; for example,
south3
.
3.
In the Summary Plots section of the page (area 4 in Figure 4-1), select the LustreOSS check box.
4.
If you want to make the graph larger than the default size, specify the width and height in the graph
attribute fields (area 9 in Figure 4-1).
5.
Click the Generate Plot button.
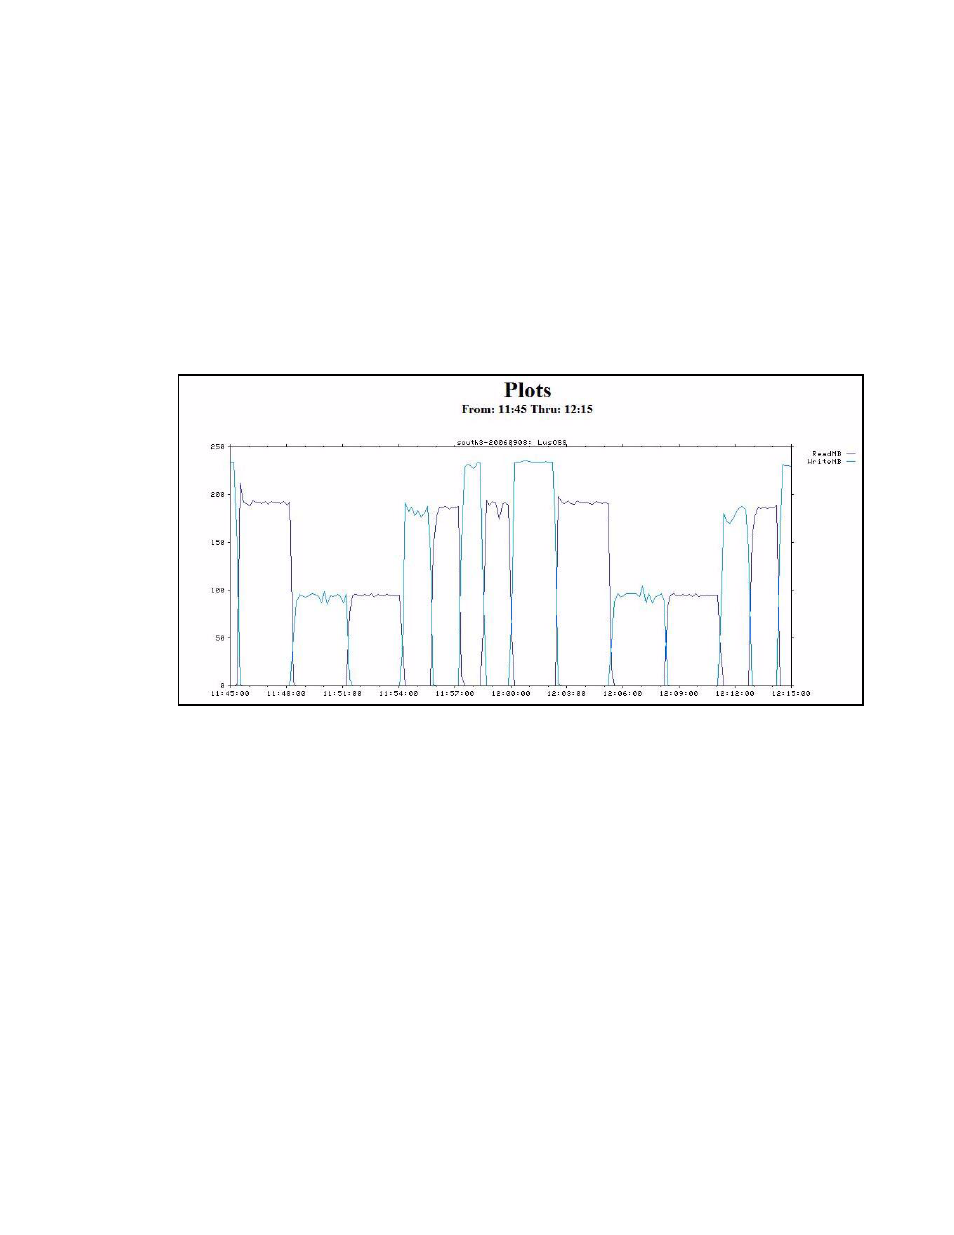
Figure 4-2 shows an example of the graph that will be generated.
Figure 4-2
A summary graph showing throughput to OST devices from a server
4.7.3.2
Viewing throughput to each OST device from a server
To view the throughput to each OST device from a server, perform the following steps on the ColPlot page:
1.
Enter the dates and times for which the graph is to be plotted (areas 1 and 2 in Figure 4-1).
2.
In the text field that allows you to specify the server name (area 3 in Figure 4-1), enter the name of the
server; for example,
south3
.
3.
In the Detail Plots section of the page (area 5 in Figure 4-1), select the LustreOSS check box.
4.
Click the Generate Plot button.
Figure 4-3 shows an example of the graph that will be generated.