IAI America RCM-101-USB User Manual
Page 242
13. Frequency
Analysis Function for SCON-CA
Controller
Anti-V
ibration Control
230
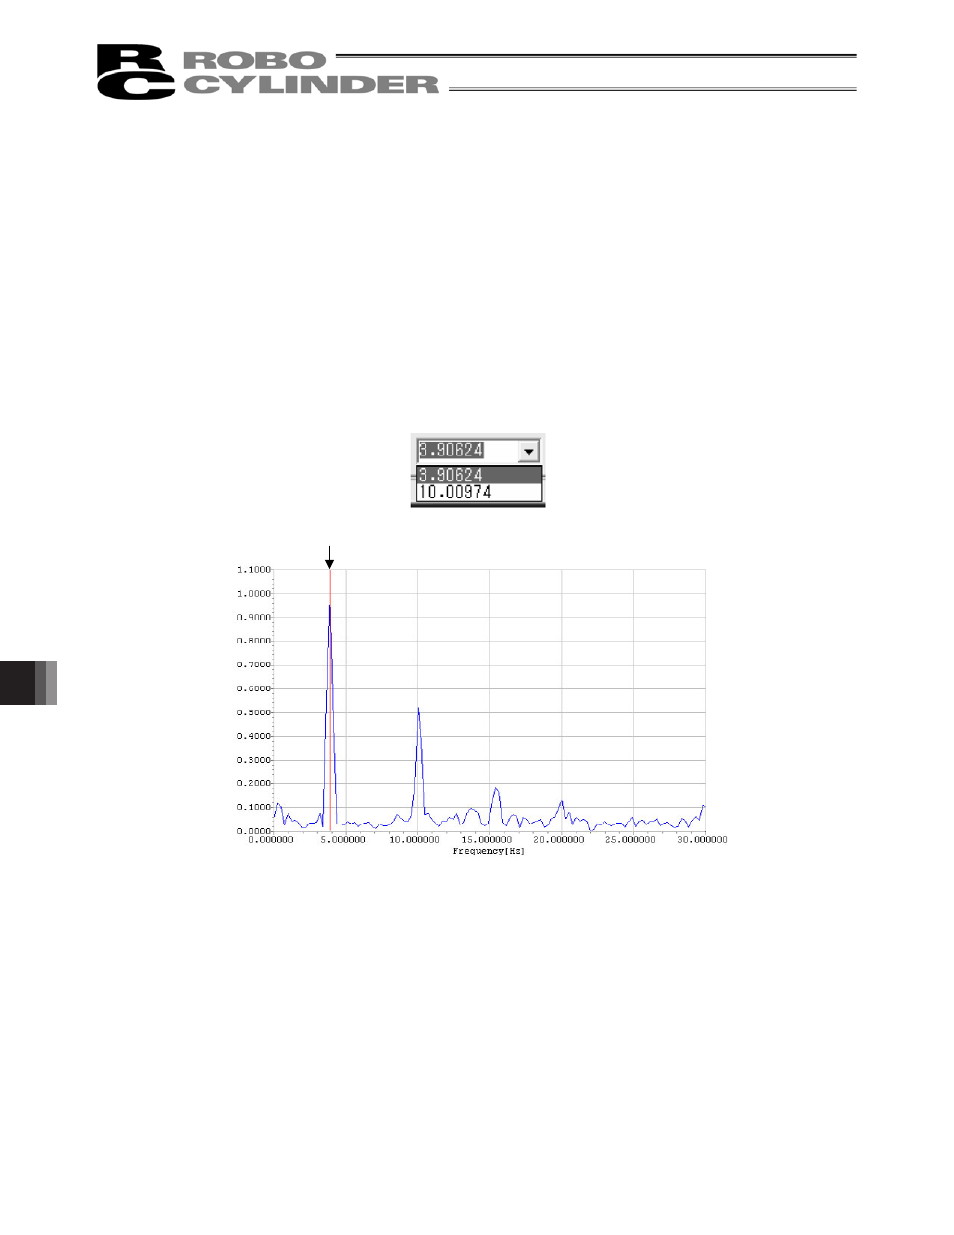
[2] Peak frequency setting
Here, set the frequency you want to set in the applicable controller parameter. Any value between 0.5
and 30 [Hz] can be set.
Enter a value directly in the input field, or click the [T] button on the right side of the input field, if
candidate peak frequencies have been set, to select a desired setting from the displayed list.
The set frequency is indicated by a red vertical line on the FFT analysis result data graph.
(Note) Up to five candidate peak frequencies are identified based on the FFT analysis result and shown.
Depending on the FFT analysis result, no candidate may be found, in which case the peak
frequency may vary from the actual vibration frequency.
(Note) If the data has been read from an existing analytical data file (file extension: fsdrc), the new
setting will be saved when the file is saved.
(Note) When the “FFT analysis result” window appears after the FFT analysis, the first candidate peak
frequency is set by default. If the data has been read from an existing analytical data file (file
extension: fsdrc), the value saved in the file is set.
Fig. 13.29 Candidate Peak Frequency List
Fig. 13.30 Indication of Set Value on Graph
[3] Maximum value of FFT
The maximum value of FFT analysis result data before normalization is shown.
(Note) If the data has been read from an existing analytical data file (file extension: fsdrc), the new
setting will be saved when the file is saved.
(Note) This value is determined by the FFT analysis result and will not change even when settings are
changed on the “FFT analysis result” window.