IAI America RCM-101-USB User Manual
Page 238
13. Frequency
Analysis Function for SCON-CA
Controller
Anti-V
ibration Control
226
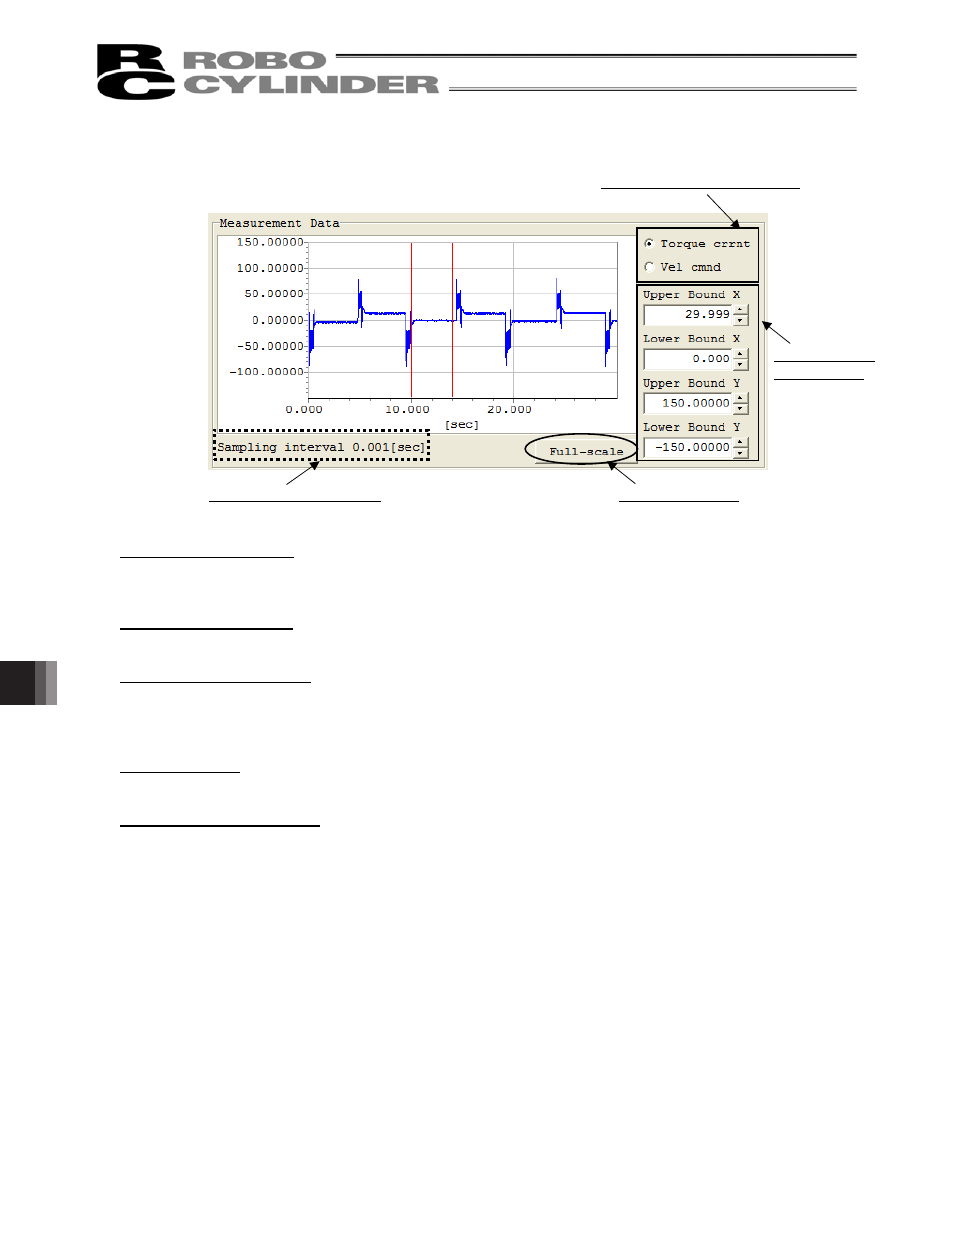
[5] Measurement Data
Fig. 13.25 Measurement Data
Measurement data graph
Imported measurement data is displayed in a graph. The vertical axis of the graph represents the amplitude
of imported waveform, while the horizontal axis represents the time.
Sampling interval display
The sampling interval of the displayed measurement data of the measurement axis is indicated.
Graph display range setting
You can change the display area of the graph by changing the values set in the four input fields.
The value set in each input field can also be changed using the buttons on the right side of the field.
Note that a range wider than the scale effective when the
Full-scale button is clicked cannot be displayed.
Full-scale button
You can click this button to display the entire measurement data in a graph.
Sampling data type selection
If new controller data is imported, you can use these radio buttons to switch the display mode between
torque current response and velocity command response.
This area is not displayed unless “Import new controller data” has been selected.
Only the data type corresponding to the sampled data can be selected.
Sampling data type selection
Graph display
range setting
Full-scale button
Sampling interval display