IAI America RCM-101-USB User Manual
Page 239
13. Frequency
Analysis Function for SCON-CA
Controller
Anti-V
ibration Control
227
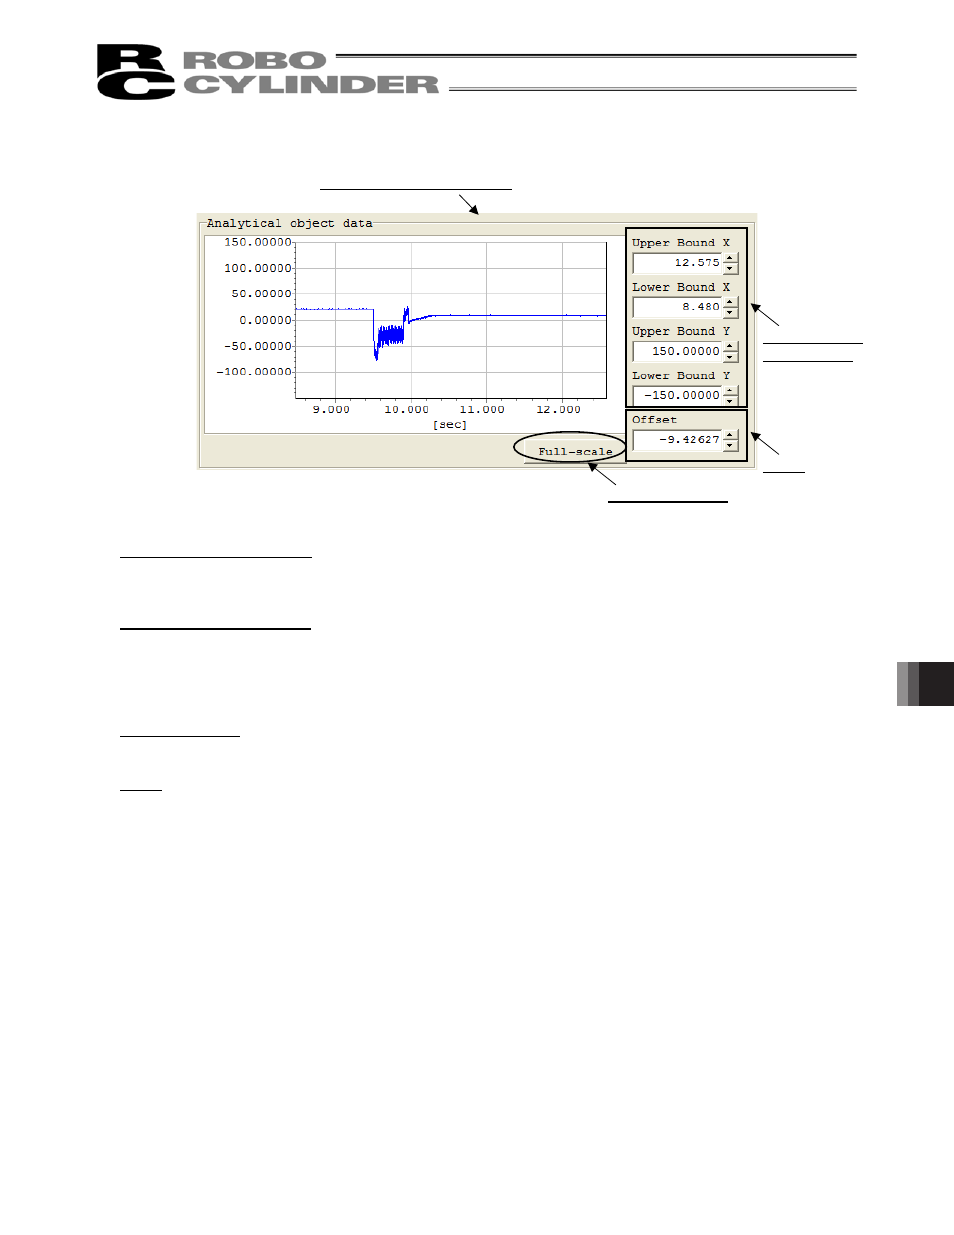
[6] Analytical object data
Fig. 13.26 Analytical Object Data
Analytical object data graph
The current analytical object data is displayed in a graph. The vertical axis of the graph represents the
amplitude of waveform, while the horizontal axis represents the time.
Graph display range setting
You can change the display area of the graph by changing the values set in the four input fields.
The value set in each input field can also be changed using the buttons on the right side of the field.
Along the horizontal axis, a range wider than the scale effective when the Full-scale button is clicked cannot
be displayed.
Full-scale button
You can click this button to display the entire analytical object data in a graph.
Offset
Use this field to move the center of amplitude of analytical object data.
The settable range is from -MAX to MAX, where “MAX” indicates the maximum absolute value of
measurement data.
If the analysis start time, number of use data or number of thinning is changed, an appropriate offset will be
calculated and set automatically.
If the data has been read from an existing analytical data file (file extension: fmd), the new setting will be
saved when the file is saved.
[7]
Execute FFT button
Click this button, and FFT analysis will be performed based on the settings you have made, for the axis
set as the analysis target.
Analytical object data graph
Graph display
range setting
Full-scale button
Offset