IAI America RCM-101-USB User Manual
Page 202
12. Off Board T
uning Function on SCON-CA
Controller
190
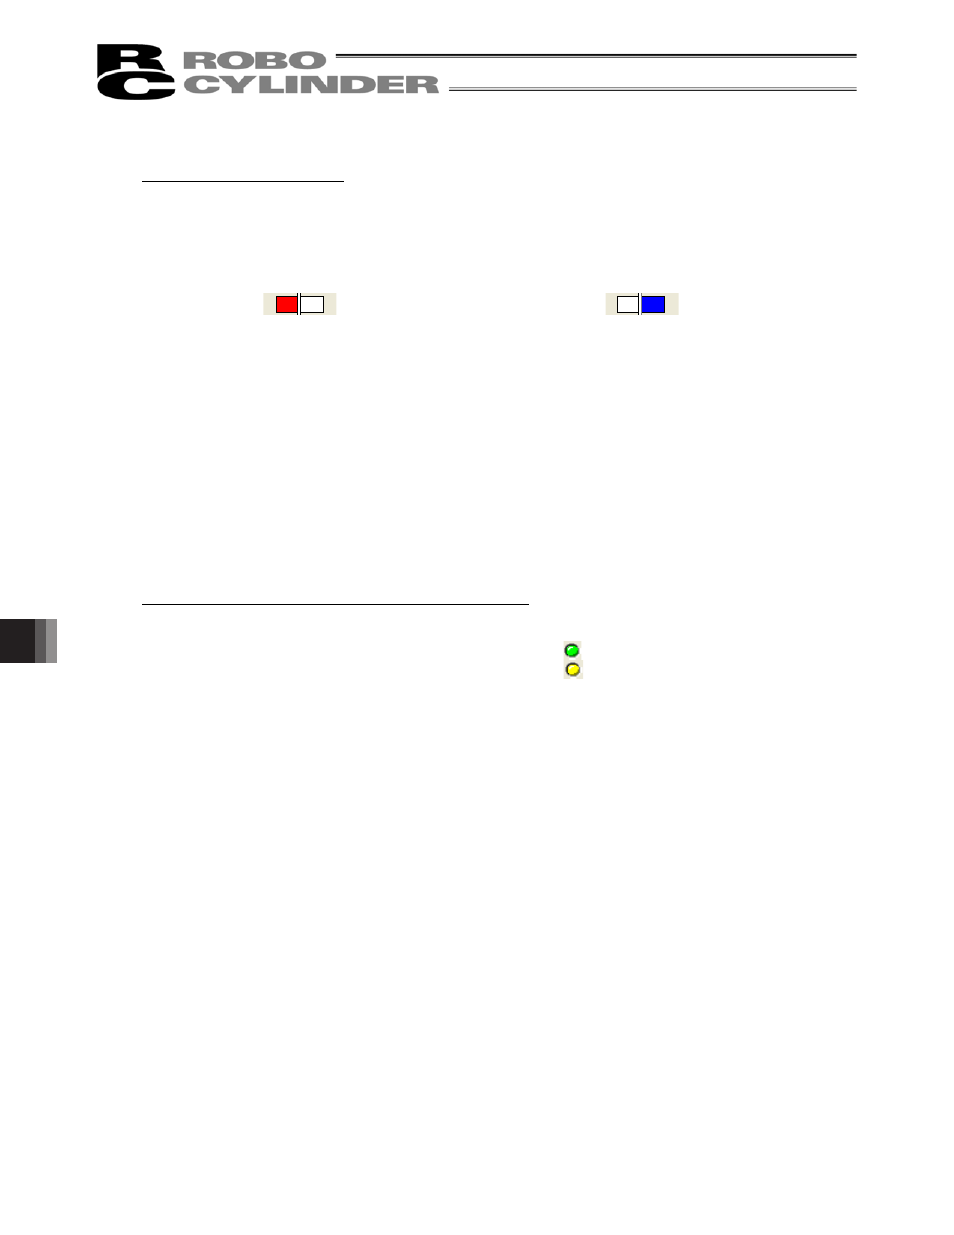
Display of adjustment degree
This shows the degree of the adjustment against the initial condition of each adjustment switch for the
five items listed on the left side of the window. The left side of the gauge extends if it is worsened and the
right side extends when there is an improvement.
The gauge for the adjustment degree is displayed in 2 steps. The worsened gauge changes as “yellow
red” while improved gauge goes “light blue blue”.
㩷
Fig. 12.35Adjustment Degree (Improved)
(most worsened condition)
Fig. 12.36Adjustment Degree (Improved)
(most improved condition)
Only red in the worsened gauge is the most worsened condition while only blue in the improved gauge is
the most improved condition that can currently be improved the most.
If taking PI Break Frequency in Figure 12.34 as an example, it can be defined that;
• the vibration, abnormal noise and overshoot are improved from the initial condition, and
• the response and suppress disturb are worsened from the initial condition.
(Note) The display of the adjustment degree is a relative display compared with the initial conditions at
the start when the Manual window is opened.
(Note) If an adjustment is made to the control velocity band, it will give an impact to the overshooting
degrees for the position gain, PI break frequency, control current band and torque filter.
Display of interlocked adjustment switch under influence
This shows the adjustment switches which are influenced by the adjustment degree and overshooting
degree when the interlocked adjustment switches are operated.
An influence is given when Interlock adjuster 1 is operated if
is displayed.
An influence is given when Interlock adjuster 2 is operated if
is displayed.
(Note) The number of interlock adjuster may differ depending on the directionality, content and the
manual data version.