IAI America RCM-101-USB User Manual
Page 193
12. Off Board T
uning Function on SCON-CA
Controller
181
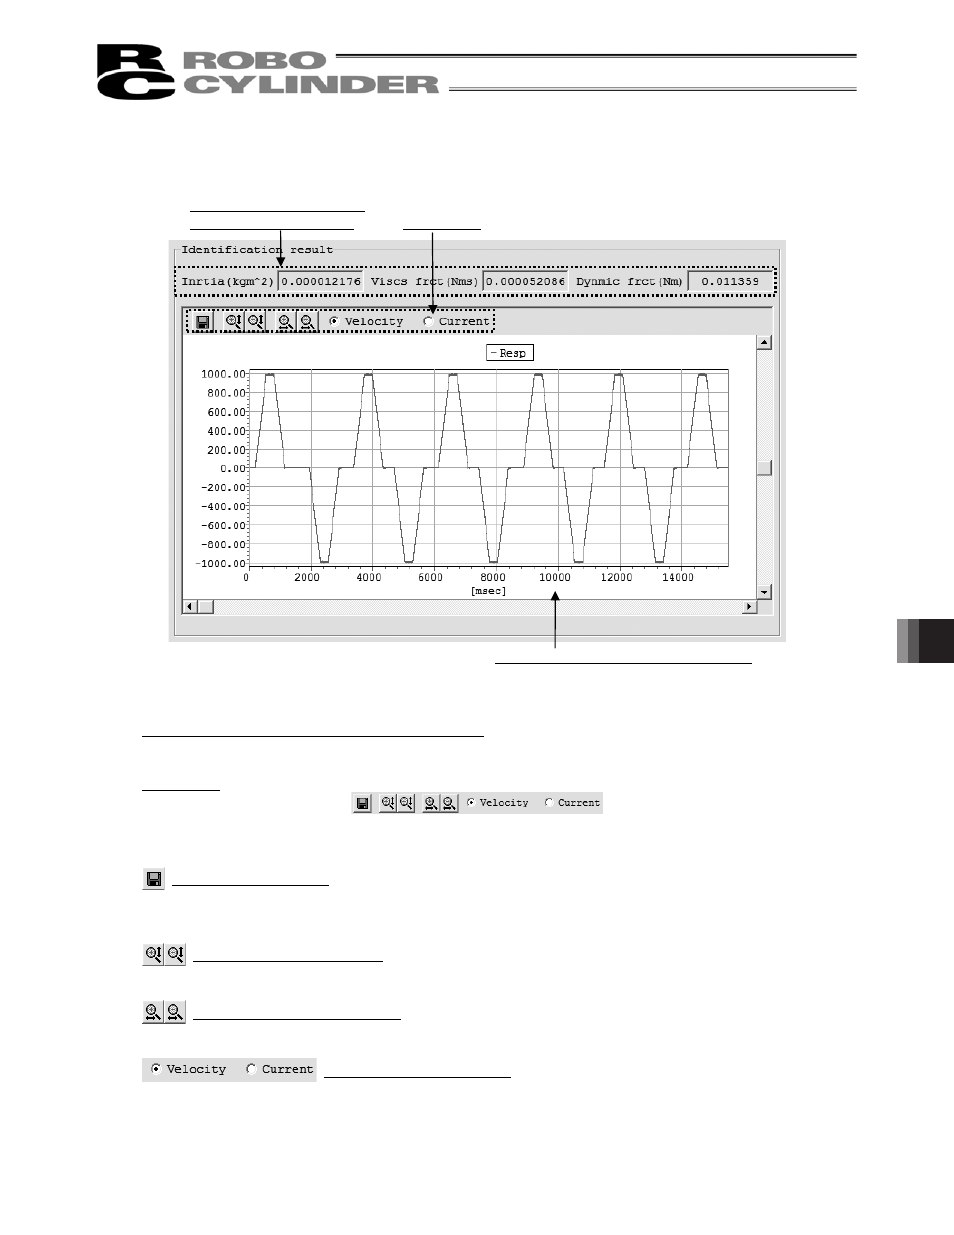
[4] System Identification Result
Fig. 12.21 System Identification Result Display
Result display for system identification calculation
In here, shows the result of the system identification calculation.
Tool button
Fig. 12.22 Tool button (Carrier load Select Window)
Save with a new name
Click this button and the data of the waveforms for the velocity and current shown in the system
identification test run result graph is saved as a csv file.
Zoom in/out of Vertical Axis
Click this button to zoom in/out the vertical axis of the system identification operation graph.
Zoom in/out of Horizontal Axis
Click this button to zoom in/out the horizontal axis of the system identification operation graph.
Displayed Data Switchover
The data (velocity/current) shown on the test run result graph can be switched over with this radio
button.
Result display for system
identification calculation
Tool button
System identification operation graph